Startup - one of the possible scenarios of the project development

In an attempt to create in your imagination a series of images that will lead a thought to one of the startup development options - either to merge a project (absorption by a competitor) or to exit it on an IPO , I will start from far away, more precisely with a quote from “Songs about relocation of souls”. As Vladimir Semenovich Vysotsky said in one of his musical interviews : “The Hindus invented good religion: that we, having given ends, do not die for good ...”
According to Steve Blanca , that: “A startup is a temporary organization to search for a repeatable, profitable and scalable business model.” The photo on the right depicts the notion of cyclicality that takes place in one of the Indian religions, which became part of Vysotsky’s work. In my opinion, such a comparison can be applied to the life cycle of a startup. In the course of its development and development, a startup inevitably approaches the stage of existence in a competitive market, when it comes time to decide on the proposals of competitors to take over the project, whether it is the leader of this market segment, or another large company. And if, even during the planning of future activities, to lay the possibility of such a development option for a startup in which the preliminary value of the project can be determined even before its release to the IPO . So, having a system of pre-selling securities in your arsenal, it is easy to do this.
What is this system of pre-sale of securities? This is a set of measures one of which is - an option contract or option . You probably ask: "And what is the difference between the proposed system and the existing tools of the stock market?"
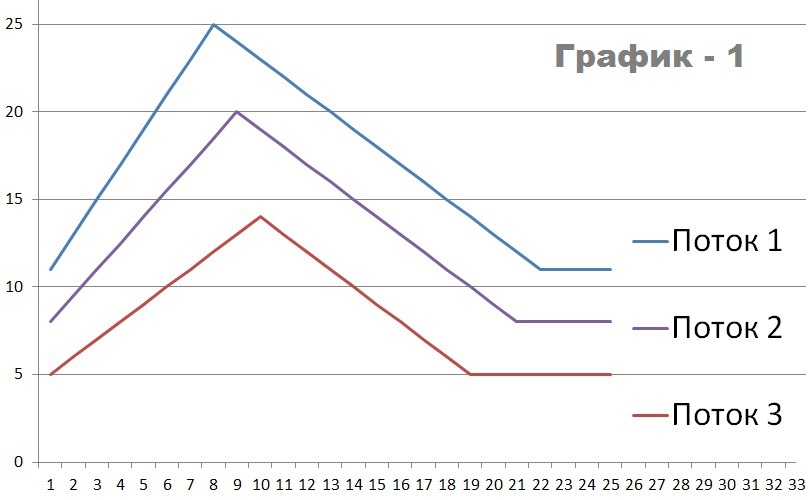
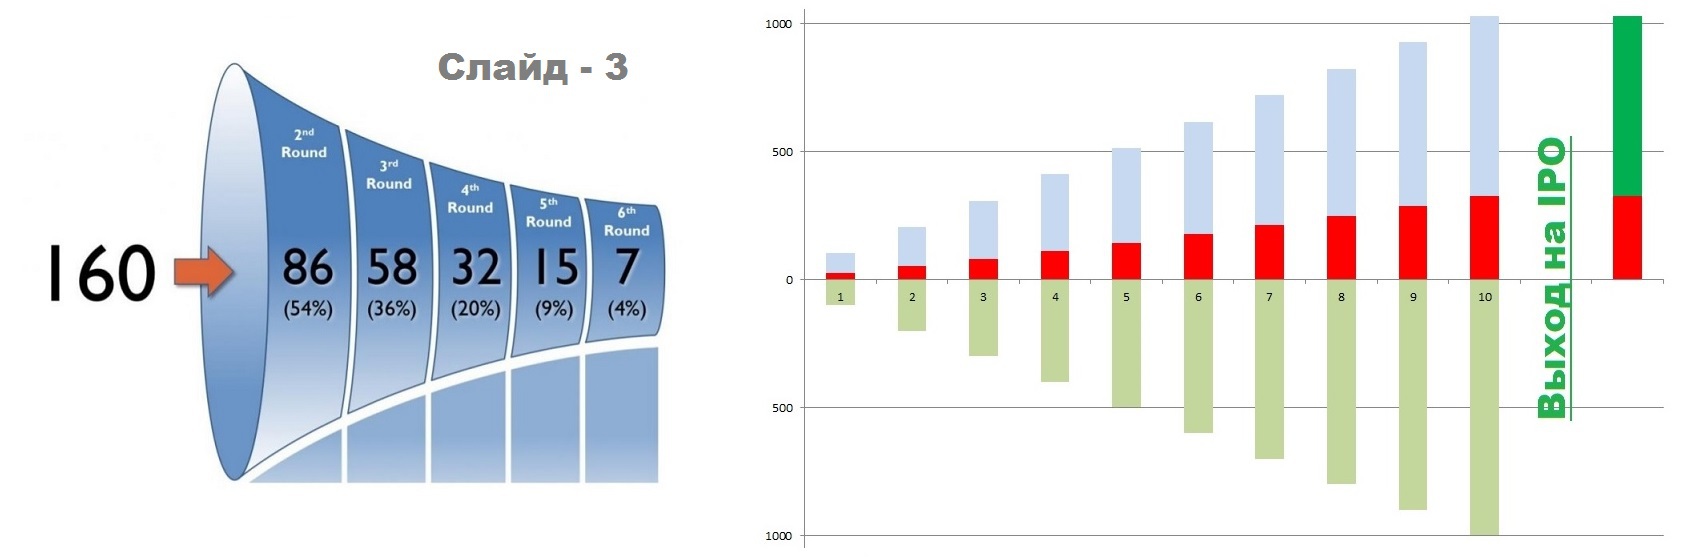
 To do this, let's look at the statistics of attracting investment capital. At the beginning, start-ups attract large-scale investments, further it becomes more and more difficult to attract funds to the project, and at the final stages for crossing the start-up finish line (IPO) - a few companies come out. The fate of those who retired and did not go to the IPO is rarely presented in bright colors. Those funds that were raised at the beginning were already over, and the next round of financing became impossible. And in these not simple financial conditions it is sometimes necessary to make a choice from the proposed merger options. And if instead of using such mechanisms to raise funds as venture funds, immediately begin preparing for an IPO. And this is how you can do it: determine for yourself the desired dates and expected accomplishments, give them tangible values. Further, on the basis of these data, start issuing options that precede the issue of shares of your company. For greater clarity, look at the graph 1 (right)
(here the y-axis is the price, the abscissa is the time in hours). It is a programmed change in the price of one company option, which is preparing to issue shares.
 Changes are made by the program, which previously made the desired parameters. In this case, it is a publicly accessible resource on the Internet, whose address is: http://krox.96.lt/ Now, in more detail ...
')
WE WILL ALLOW FOR AN EXAMPLE that you estimate your start-up and investments necessary for attracting in the foreseeable future at ≈ 1`000`000 conventional money units (cu), the estimated period of development and formation of the company, before entering the IPO ≈ 3 years (for convenience, we take 1`000 days). We take 10% of the volume of funds required for raising funds, this is $ 100,000 USD. and issue options on them, but not at a fixed price. Let the price determine the market. To do this, we divide the first part of the options, which will be sold in the first round lasting 100 days, into different price streams:
- Flow 1 - 10% of options released for the first round
- Flow 2 - 25% of the same amount.
- Flow 3 - 65% (the largest part)
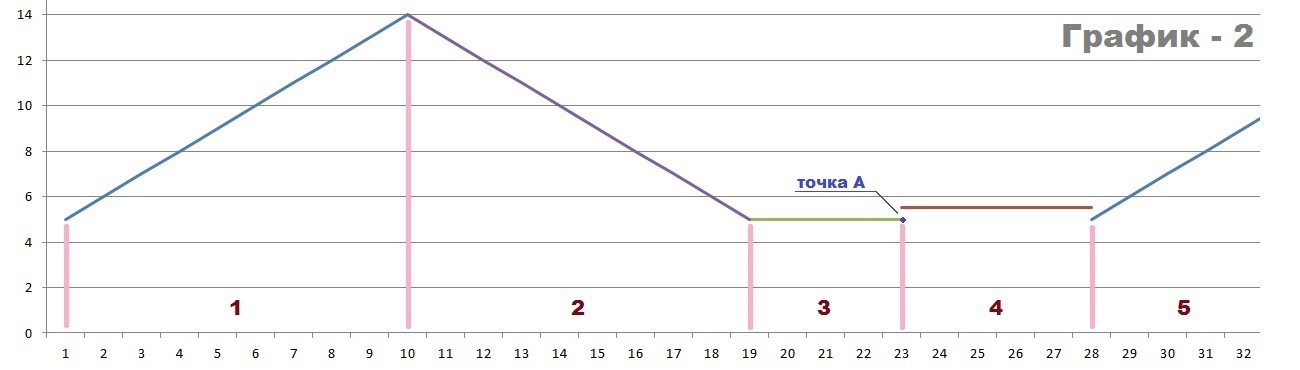
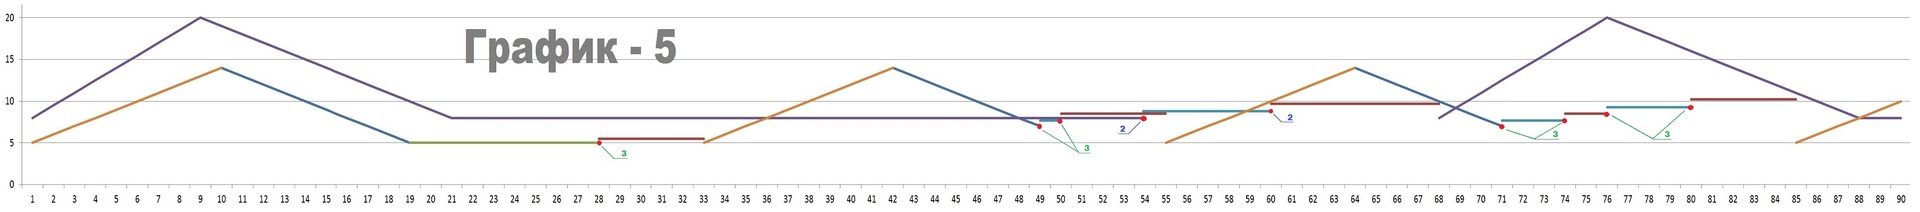
Now the fun begins - bidding. Let us look to chart 2 (below) . It depicts a cycle, according to which the price of options in the “Stream 3” will change (from our example). The first part of the chart shows how the price will automatically go up; let's call this part of the chart the phase of automatic price increase. In the second part of the chart, the price automatically decreases, let it be the phase of automatic price reduction. In the third part of the chart, the price is at the minimum level, called the phase with the minimum price. "Point A" - becomes the culmination of the sales process. This is because immediately after the sale of the option from Stream 3 , the price goes into the phase of active selling (the fourth part of the chart). It differs from the previous one by a predetermined value (in this example, it is 10% more from the price of the option just sold). If during the active sales phase, which lasts for a certain time, the transaction does not occur, the price moves to phase number five - that is, it returns to the automatic price increase phase. And the cycle of price change is repeated, starting with the minimum for this stream.
Now consider the following situation (graph 3) , in which there are several purchases of options in a row. For each subsequent trade, the price in this example increases by 10% (part of the chart is seven and nine). If during the active sales phase there were no options purchases (for a period of 5 periods of time, in our case), the price for the price changes from active sales to the automatic price increase phase (the eighth part of the chart). As you have already understood from the graphs, the price of options will NEVER (!) Decrease a less programmed value, and this introduces PREDICTION to the process of price change on options.

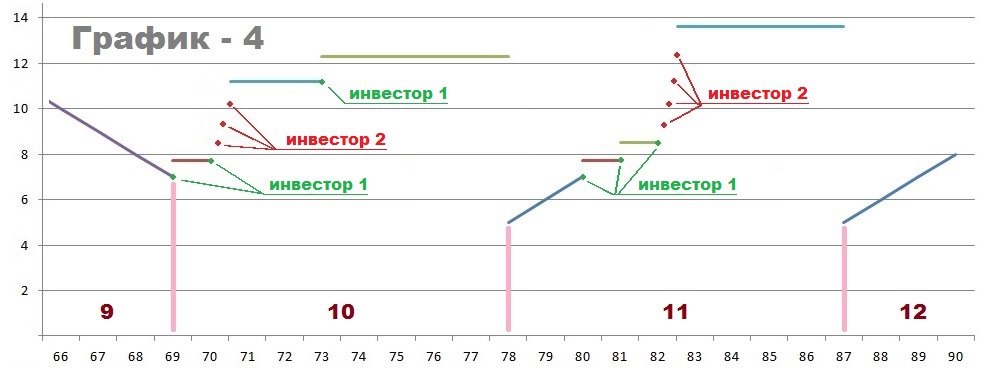
It was the turn to consider the situation with the participation of several investors simultaneously. In the tenth and eleventh parts of the chart, 4 red and green dots mark the price values at the time of purchase. There is clearly traced competition between buyers of securities who are willing to buy them, even above the minimum price. And they compete with each other, thereby raising the price for the next transaction.
Now we come to the moment when several price streams appear, which differ among themselves in all parameters. Chart 5 (click and this graph will appear in an enlarged form) shows the result of the interaction between the program for changing the price of an option representing your interests and the buyers of your securities. The program from different current prices in the streams - selects the minimum and offers it to a potential investor. For ease of demonstration, only two price streams are involved here. Red dots indicate options sales (from Flow 2 and Flow 3 ). The average value of funds raised from the sale of securities is greater than the sale at a fixed minimum price (in this example, 69 USD divided by 9 options = 7.66 USD, versus 5 USD sold at a fixed minimum price).
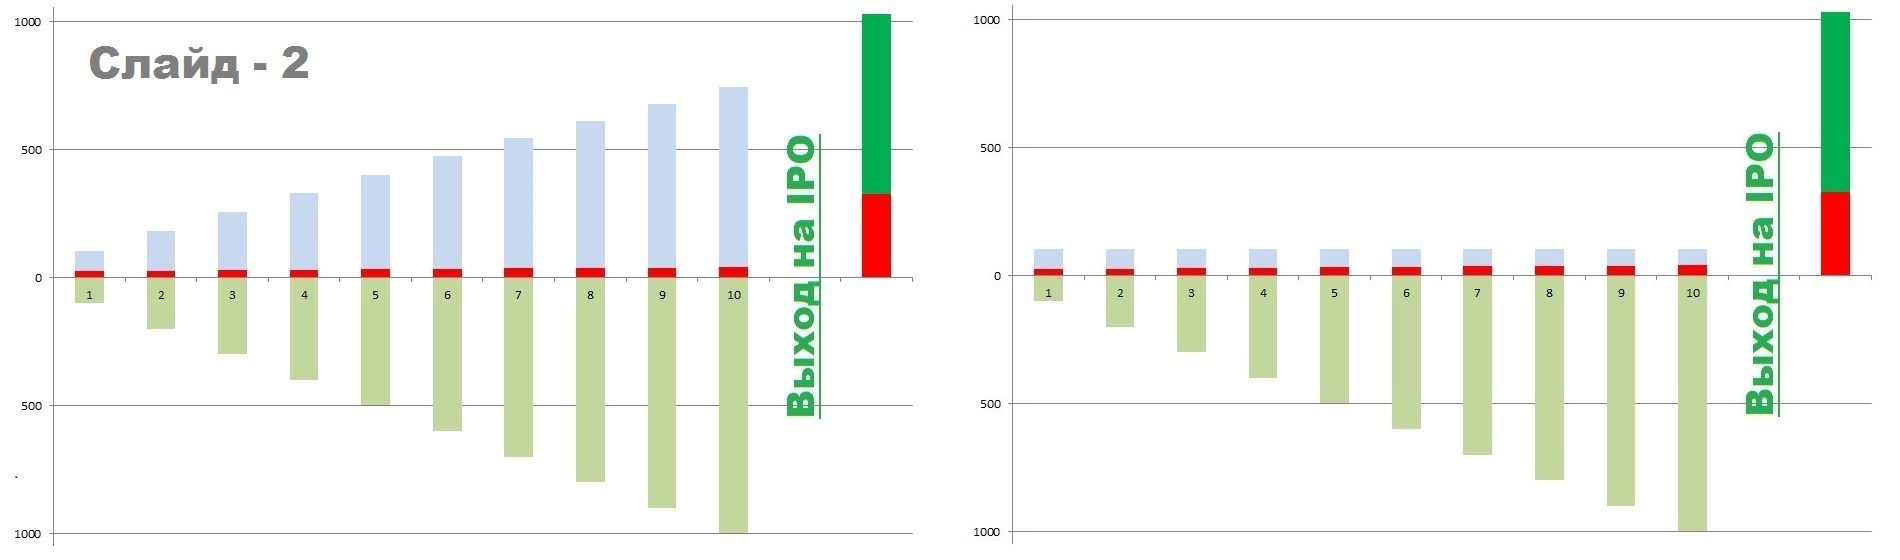
And so I took you to the moment when 100 days had passed since the start of the fundraising campaign (the first investment tour was over). Summing up the results and immediately launching the second investment tour (in our example - again for collecting investments in the amount of $ 100`000). A natural question arises. According to the results of the first round, there may be non-invested options, what to do with them? Option one is to add them to the securities of the second round, option two is not to sell them, but to go to an IPO with a larger number of shares. Both options are depicted on Slide 2 . The left histogram shows 10 investment tours, each of which includes 10% of the total investment and options not sold in the last round. The right diagram shows that in each investment round only 10% of the total volume of attracted investments was put up for sale. The red color on both histograms shows the amount of money raised at the end of the tour. The light green color indicates the volume of options already issued. Green indicates the number of shares issued in an amount equivalent to the number of remaining options.
As you have already seen that the system I propose differs from the option sale system at a fixed price (for example, the system with a fixed price for an option attracts investments into the company now - boststart.Ru.ru “saved version of the page” ). Therefore, the number of attracted investments from the sale of options and the volume of issued shares exceeded 1'000'000 cu. (taken by us for this example ). I would also like to note that a similar system for attracting investments in start-ups operates in the company iangels.co , about which you can learn from the video presentation . For comparison, evaluate the possibilities of entering the IPO by finding and attracting venture capital and by selling options without a fixed price. In my proposed system, it is difficult not to go to an IPO, since the high level raised at the very beginning will serve you as an additional incentive, and the intermediate results of attracting investments will be for you, so to say, a litmus test confirming the correctness of your choice.
Now about what area of application I see for this system. The first application is described by me above.
The second option is the preparation for a merger or acquisition by another company. The tool offered by me will allow you to have in your arsenal more powerful arguments in the form of options already sold when you merge or merge.
The third area of application for a system with a variable price seems to be the sale of exclusive products for which the price is not yet known, since there are no analogues of the product yet.
And one more variant of using this system is presented in the advertising sphere, for example, for selling ad impressions to users of some popular service. Impressions to sell in portions of 500-1000 in one order, the higher the demand for the advertising service, the more the price of the impressions will increase.
If the reading of this article has not yet completely tired you, then I can suggest to see how this model works on a real site. To do this, click on the alien guest, carefully studying the text of the epigraph and he will transfer you to the minimum working version of such a service.
Source: https://habr.com/ru/post/294664/
All Articles