4 types of memory leaks in javascript and how to deal with them
In this article, we will look at common types of memory leaks in client-side JavaScript. We will also learn how to detect them using the Chrome Development Tools.
Translator's note: the first part of the article is full of translator's notes. During the analysis of the material, it became clear that some points should be clarified separately.
Introduction
Memory leaks belong to the kind of tasks that each developer sooner or later faces. Languages with automatic memory management do not solve all problems at once - there are still situations where memory leaks. Leaks cause a whole class of different problems: user interface delays, freezes and even problems with other applications.
What is a memory leak?
Memory leak - memory that is no longer required by the application, but for some reason is not returned to the operating system or the pool of available memory ( translator's note: in a heap ). Programming languages use different approaches that reduce the risk of memory leaks, but the very problem of whether a specific piece of memory is still needed or not is algorithmically unsolvable ( translator's note: it comes down to the problem of stopping ). In other words, only the developer can determine whether it is possible to return a specific piece of memory to the operating system. Memory management in programming languages is divided into manual and automatic. The first type provides the developer with a set of tools to help directly interact with the memory. In the second, there is a special process called the “garbage collector” ( eng. Garbage collector) that is called automatically and deletes the memory.
Translator's note: this is described in more detail in Wikipedia: garbage collection , manual memory management , garbage collection .
Javascript memory management
JavaScript is a programming language with a built-in garbage collector. The collector periodically checks which of the chunks allocated to the application remain “reachable” from various parts of this application. In other words, the garbage collector translates the question “what memory is still needed?” To the question “what memory can I access?”. The difference seems insignificant, but this is not the case: although only the developer knows whether a fragment of allocated memory is required in the future or not, unreachable memory can be calculated algorithmically and marked for return to the OS.
Languages that do not have garbage collectors work on different principles. For example, there is an explicit memory management: the developer directly tells the compiler that this piece of memory can be deleted. There is also a reference counting algorithm, in which the number of its uses is associated with each memory block (and when it is reset, the block returns to the OS). These techniques have their pros and cons, and can lead to memory leaks.
Translator's note: the reference counting algorithm is also used in garbage collectors. In addition, it is worth noting that the operation of this algorithm in its basic form can lead to the emergence of circular references, in which unused objects link to each other, mutually blocking the deletion. Read more - on Wikipedia .
Javascript memory leaks
The main cause of memory leaks in languages with garbage collectors are unwanted links . To understand what it is, let's first consider how the garbage collector checks the reachability of objects.
Mark-and-sweep algorithm
Most garbage collectors use the mark-and-sweep algorithm:
The garbage collector builds a list of "root objects", or "roots." As a rule, they become global variables declared in the code. In JavaScript, the typical root is the
windowobject. Since thewindowexists throughout the entire operation of the page, the garbage collector will understand that this object and its descendants will always be present in the execution environment of the program (that is, they will not become garbage).The collector recursively circumvents the roots and their descendants, marking them as active (ie, not trash). Everything that can be reached from the root is not considered as garbage.
- After the second step, fragments of memory that are not marked as active can be considered garbage. Now the collector can free this memory and return it to the OS.
Modern garbage collectors improve this algorithm, but its essence remains the same: mark accessible fragments of memory, and declare the rest as garbage. Now it is possible to define unwanted links — these are links that are reachable from the root, but refer to fragments of memory that will never be needed again. In JavaScript, unwanted links will become outdated variables, forgotten in the code, retaining in memory more unnecessary objects. By the way, some believe that these are the mistakes of the developers, not the language.
So, to figure out what usually causes memory leaks in JavaScript, we need to understand which situations lead to unwanted links .
Translator's note: before reading further, I recommend to look at the MDN article on memory management , which reveals the topic in more detail.
The four most common types of memory leaks in JavaScript
Translator's note: hereinafter in the examples we will consider client-side JavaScript. It will be considered, without unnecessary clarifications and reservations, that we have a global window object. In a different execution environment, the JavaScript window may not be present, but the reasons for the leaks discussed in the article will be relevant.
1: Random global variables
One of the goals in the development of JavaScript was to create a language similar to Java, but so weak that even beginners could work with it. One of the easing of the language was the handling of undeclared variables: accessing such a variable will create a new variable in the global object. Thus, if we consider the code:
function foo(arg) { bar = " "; } In fact, it means:
function foo(arg) { window.bar = " "; } If you want bar contain a reference to a variable only inside the scope of the foo function, but forget to specify var in the declaration, then a global variable will be created. In this case, a simple string will create a memory leak. It will not do much harm, but, of course, the situation could be much worse.
Another way to create a random global variable is to use this :
function foo() { this.variable = "potential accidental global"; } // foo , this // (window), // , undefined. foo(); To avoid such errors, add 'use strict' ; to the top of the javascript files. This is a directive that includes a strict JavaScript parsing mode that prevents the occurrence of random global variables.
Note on global variables
Let's talk not about random, but about explicitly declared global variables. By definition, they are not handled by the garbage collector, unless you equate them to null or reassign. In particular, this applies to global variables used for the temporary storage and processing of large data blocks. If you need a global variable to write a large amount of information into it, make sure that at the end of working with the data its value will be set to null or redefined.
An example of increased memory consumption associated with global variables are caches — objects that store reused data. To work effectively, they should be limited in size. If the cache grows without limits, it can lead to high memory consumption, since its contents cannot be cleared by the garbage collector.
2: Forgotten timers and callbacks
Such usage of the setInterval function is quite common:
var someResource = getData(); setInterval(function() { var node = document.getElementById('Node'); if(node) { // - node someResource. node.innerHTML = JSON.stringify(someResource)); } }, 1000); This example shows how harmful timers (that access nodes and data that are no longer needed) are harmful. If you delete a node, the entire block inside the handler function becomes unnecessary. But, as long as setInterval active, the handler is also active and cannot be cleared by the garbage collector (after all, to do this, you must first stop the interval). So, its dependencies also can not be removed from memory. We obtain that someResource , which probably stores a large amount of data, cannot be cleared by the garbage collector.
Let's talk about callbacks. Most often they are used in event handlers and in third-party libraries. Libraries usually create their own event handlers and other support tools that handle callbacks. Usually they also provide ways to remove external handlers after an object becomes unreachable.
Now consider the situation with event handlers. Handlers should be deleted when they are no longer needed, or the objects associated with them become unavailable. In the past, this was critical, as some browsers (Internet Explorer 6) did not know how to correctly handle circular links (see note below). Most modern browsers remove event handlers as soon as objects become unreachable. However, it is still the rule of good taste to explicitly remove event handlers before deleting the object itself. For example:
var element = document.getElementById('button'); function onClick(event) { element.innerHtml = 'text'; } element.addEventListener('click', onClick); // - . element.removeEventListener('click', onClick); element.parentNode.removeChild(element); // , , // , onClick. // , // . A note about event handlers and circular references
Event handlers and circular references have long been considered a problem for JavaScript developers. This was due to an error (or design solution) of the garbage collector in Internet Explorer. Older versions of Internet Explorer could not detect circular references between DOM elements and JavaScript code. Add to this that event handlers usually contain a reference to the event object (as in the example above). This means that every time a listener was added to the DOM node in Internet Explorer, a memory leak occurred. Therefore, web developers began to explicitly delete event handlers before removing DOM nodes or reset the links inside the handlers. Modern browsers (including Internet Explorer and Microsoft Edge) use algorithms that find circular links and correctly process them. Now it is not necessary to call removeEventListener before removing the node.
Frameworks and libraries, such as jQuery, remove handlers before removing the node itself if the library API was used to create them. This is done by the libraries themselves and ensures that there are no leaks, even when working with problem browsers, such as the old Internet Explorer.
3: Links to deleted items from DOM
Sometimes it is useful to store DOM nodes inside data structures. Suppose you want to dot-update the contents of several rows in a table. It makes sense to keep a reference to each DOM row in a dictionary or array. In this case, two links will point to the same DOM element — one in the DOM tree and the other in the dictionary. If in the future you decide to delete these lines, you will need to make both links and other links unreachable.
var elements = { button: document.getElementById('button'), image: document.getElementById('image'), text: document.getElementById('text') }; function doStuff() { elements.image.src = 'http://some.url/image'; elements.button.click(); console.log(elements.text.innerHTML); // . } function removeButton() { // body. document.body.removeChild(document.getElementById('button')); // #button // elements. // .. // . } In addition to this, you need to do something with references to the internal nodes of the DOM tree. Suppose that we store in the code a link to some specific table cell (to the <td> ). In the future, we decide to remove the table from the DOM, but save the reference to this cell. Intuitively, we expect the garbage collector to clean everything except this cell. However, in practice it will be different: since the cell is a descendant of the table, it stores references to its parents. It turns out that a reference to a table cell will force the entire table to be stored in memory. Consider this when you save references to DOM elements.
4: Closures
The core of JavaScript is closures: functions that receive variables from parent scopes. The developers of Meteor discovered a situation in which, due to the nature of the implementation of the JavaScript runtime, you can create a memory leak in such a tricky way:
var theThing = null; var replaceThing = function () { var originalThing = theThing; var unused = function () { if (originalThing) console.log("hi"); }; theThing = { longStr: new Array(1000000).join('*'), someMethod: function () { console.log(someMessage); } }; }; setInterval(replaceThing, 1000); This example does one simple thing: each time replaceThing is replaceThing , theThing receives a new object containing a large string and a new closure ( someMethod ). In this case, the unused variable contains a closure referencing originalThing (and this is theThing from the previous replaceThing call). Already something confuses, right?
It is important to note that since the scope is created for closures that are still in the same parent scope, this scope will be common. In this case, the scope created to close someMethod is shared with unused . unused stores the link to originalThing . Although unused and not used, someMethod can be used in theThing . Since someMethod shares the scope with unused , even if unused never used, its reference to the originalThing causes it to always remain active (that is, protect it from the garbage collector).
With this code, you can observe a constant increase in memory usage. The amount of memory does not decrease even when the garbage collector comes into play. In fact, we create a list of associated closures (with the root as the theThing variable), and each of these closures contains a direct reference to the large string, which represents a significant memory leak. This is an implementation artifact. With a different implementation of closures, it is potentially possible to handle this situation, which is explained in the Meteor blog.
Non-obvious behavior of garbage collectors
Although garbage collectors are useful, they have their drawbacks, one of which is non-determinism . This means that garbage collectors are unpredictable - it is usually impossible to determine when garbage collection will be made. As a result, sometimes the program takes up more memory than is required. There may also be short pauses, which will be especially noticeable in programs that quickly respond to actions.
Non-determinism means that we cannot say for sure when garbage collection will take place, however, most implementations of garbage collectors have similar behavior. If no memory allocation is performed, the garbage collector does not manifest itself. Consider the following scenario:
- There was a significant amount of memory allocation.
- Most of the items (and possibly all) were marked as unreachable (for example, we assigned
nullvalues to links to unnecessary cache). - Subsequent allocations are not performed.
In this case, most garbage collectors will not take further action. In other words, although there are unreachable links that can be processed, the garbage collector will not affect them. Due to such minor leaks, the application will consume more memory than necessary. Google gave a great example of this behavior - JavaScript Memory Profiling docs, example # 2 .
An overview of the profiling tools in Chrome
Chrome provides a set of tools for profiling memory consumption in JavaScript. There are two important tools for working with memory: the timeline tab and the profiles tab.
Timeline tab
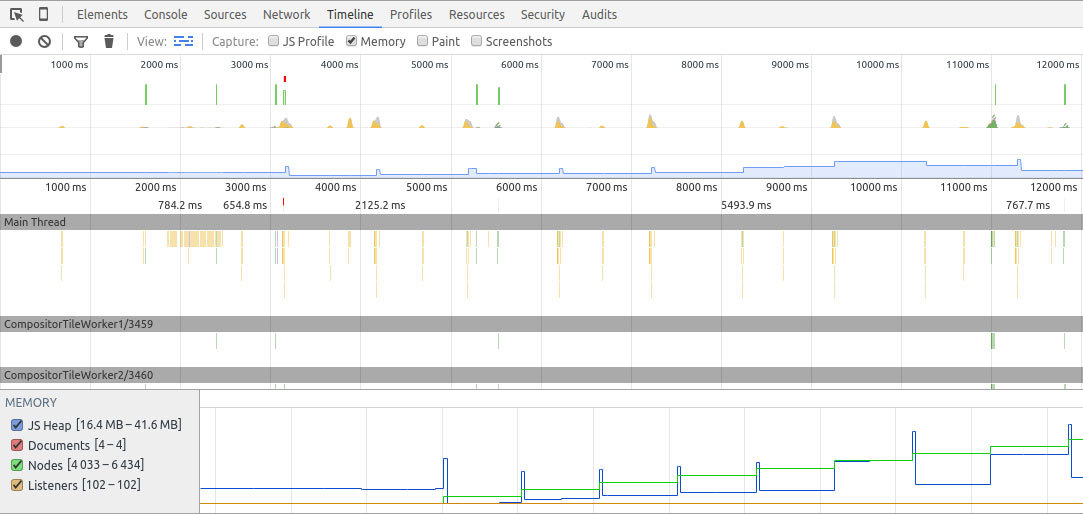
The timeline tab is invaluable for detecting unusual memory behavior. When searching for large leaks, pay attention to periodic jumps, slightly decreasing after garbage collection. The screenshot shows the continuous growth of objects causing memory leaks. Even after a large sweep at the end, the total amount of memory occupied is greater than at the beginning. The number of DOM nodes also increases. Everything indicates that there is a leak in the code associated with DOM nodes.
Profiles Tab
You will spend most of your time working with this tab. Profiles allow you to make memory snapshots and compare them with each other. You can also record the process of distributing memory. In any of the modes, different types of output are available, but most of all we are interested in the general list and the comparison list.
The general list provides an overview of the different types of related objects and their set of sizes: shallow size (surface size, the sum of all objects of a particular type) and retained size (held size, surface size plus the size of other objects associated with a given). It also gives us an idea of how far an object is from its root ( distance field).
The comparison list provides us with the same information and makes it possible to compare different snapshots. This is especially important for memory leak searches.
Example: Looking for bugs with Chrome
There are two main types of memory leaks: leaks that cause periodic increases in used memory and single leaks that do not cause further increases in memory. Obviously, the easiest way to track periodic leaks. In addition, they are the most dangerous: if the memory consumed is constantly increasing, in the end such leaks will slow down the browser or stop the execution of the script. Non-periodic leaks are easy to find if they are large enough to recognize them among others. Usually they do not cause serious problems, so they often remain undetected. Leaks that happen only once can be considered only as optimization problems. But periodic leaks are full-fledged bugs that need to be fixed.
Consider the code from the examples in the Chrome documentation :
var x = []; function createSomeNodes() { var div, i = 100, frag = document.createDocumentFragment(); for (;i > 0; i--) { div = document.createElement("div"); div.appendChild(document.createTextNode(i + " - "+ new Date().toTimeString())); frag.appendChild(div); } document.getElementById("nodes").appendChild(frag); } function grow() { x.push(new Array(1000000).join('x')); createSomeNodes(); setTimeout(grow,1000); } The grow function, when invoked, will start creating <div> nodes and adding them to the DOM. It will also associate a large string with them and attach it to an array created in the global scope. This will cause a steady increase in memory, which can be detected using the tools we considered.
For languages with garbage collectors, fluctuations in the memory schedule are characteristic. This is expected if memory distribution is cyclical, as it usually happens. We will look at periodic memory increases that do not return to their original state after a garbage collector has been processed.
How to detect a periodic increase in memory
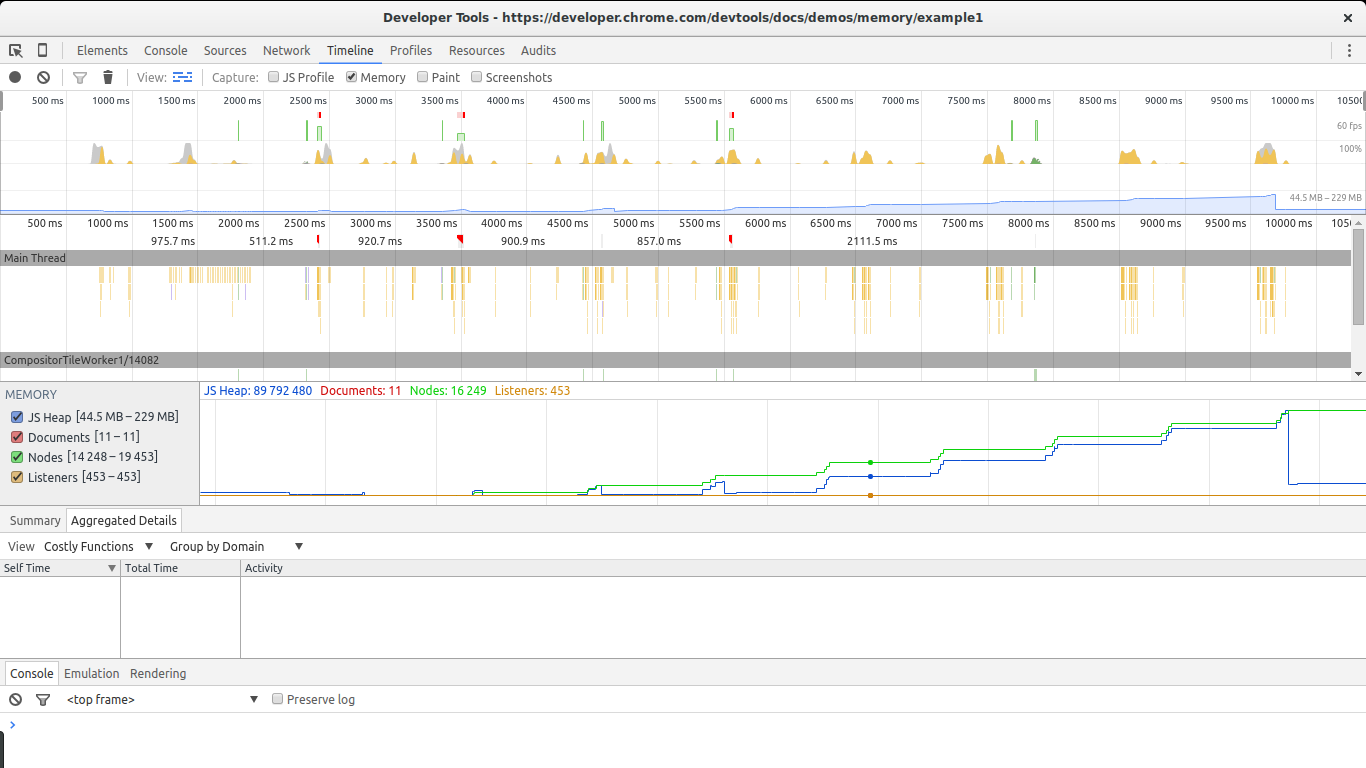
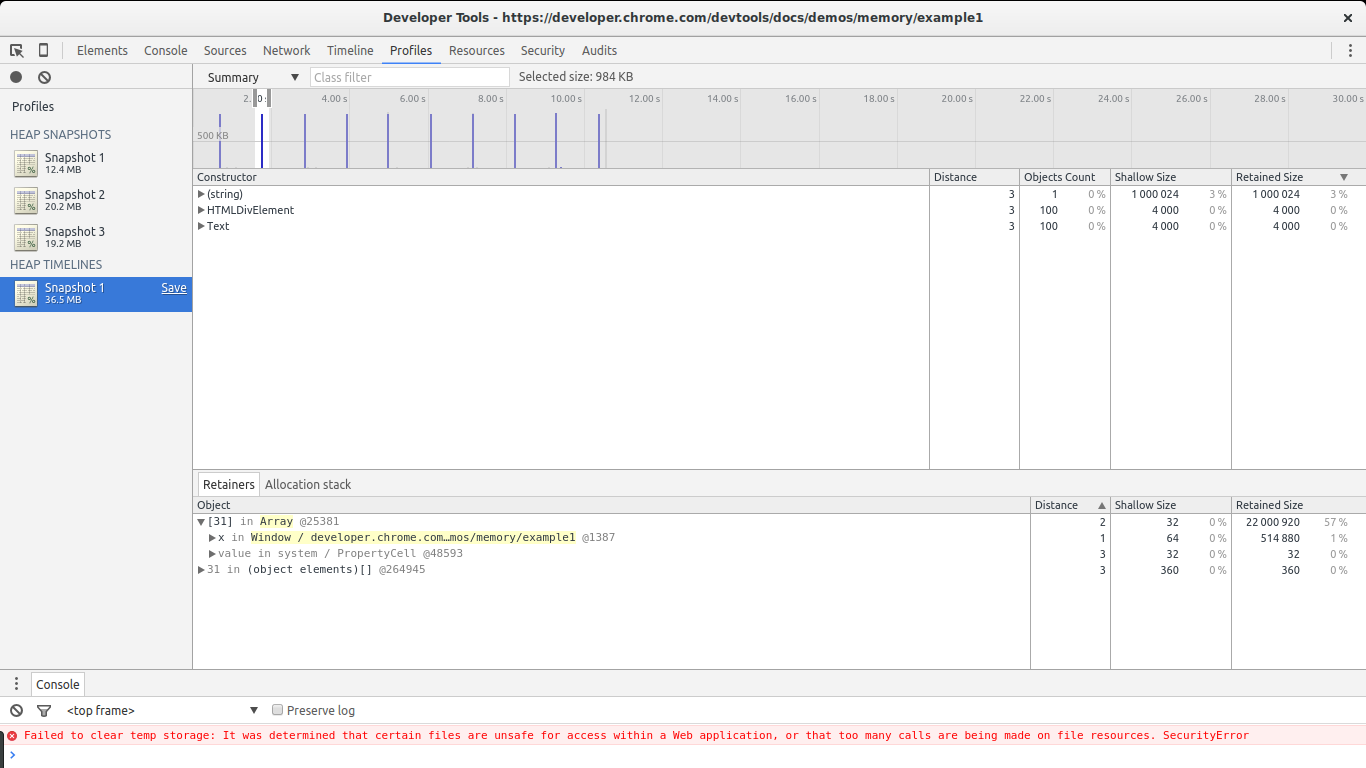
For this we need the timeline tab. Open the example in Chrome, open the Dev Tools, select the timeline , select the memory and click on the record. Then go to the page and click The Button . A memory leak will begin. After some time, stop recording and look at the results.

This example will continue to create memory leaks every second. After stopping the recording, set a breakpoint in the grow function so that the script stops and prevents Chrome from closing the page. In this screenshot, there are two large signs of memory leaks: the nodes graph (nodes, green line) and the JavaScript code graph (blue line). DOM nodes are always increasing and never decreasing. This is an occasion to think.
A graph of javascript code also shows a constant increase in consumed memory. It is more difficult to recognize because of the work of the garbage collector. You can see how the memory initially increases, then its reduction follows, and then again an increase and a jump, followed by another decrease in memory, etc. What is important in this situation is that after each memory clearing, its total size still remains larger than the previous one. That is, although the garbage collector manages to free a significant amount of memory, anyway, some part of it leaks regularly.
So now it is clear that we have a leak. Let's find her.
Make two snapshots
To find a leak, move to the profile section. To control the amount of memory, reload the page. We need the function Take Heap Snapshot .
Reload the page and take a picture immediately after it has finished downloading. This picture we take as a basis. After that, press The Button again, wait a couple of seconds and take a second shot. After the snapshot is taken, it is better to put a breakpoint in the script to stop further memory consumption.
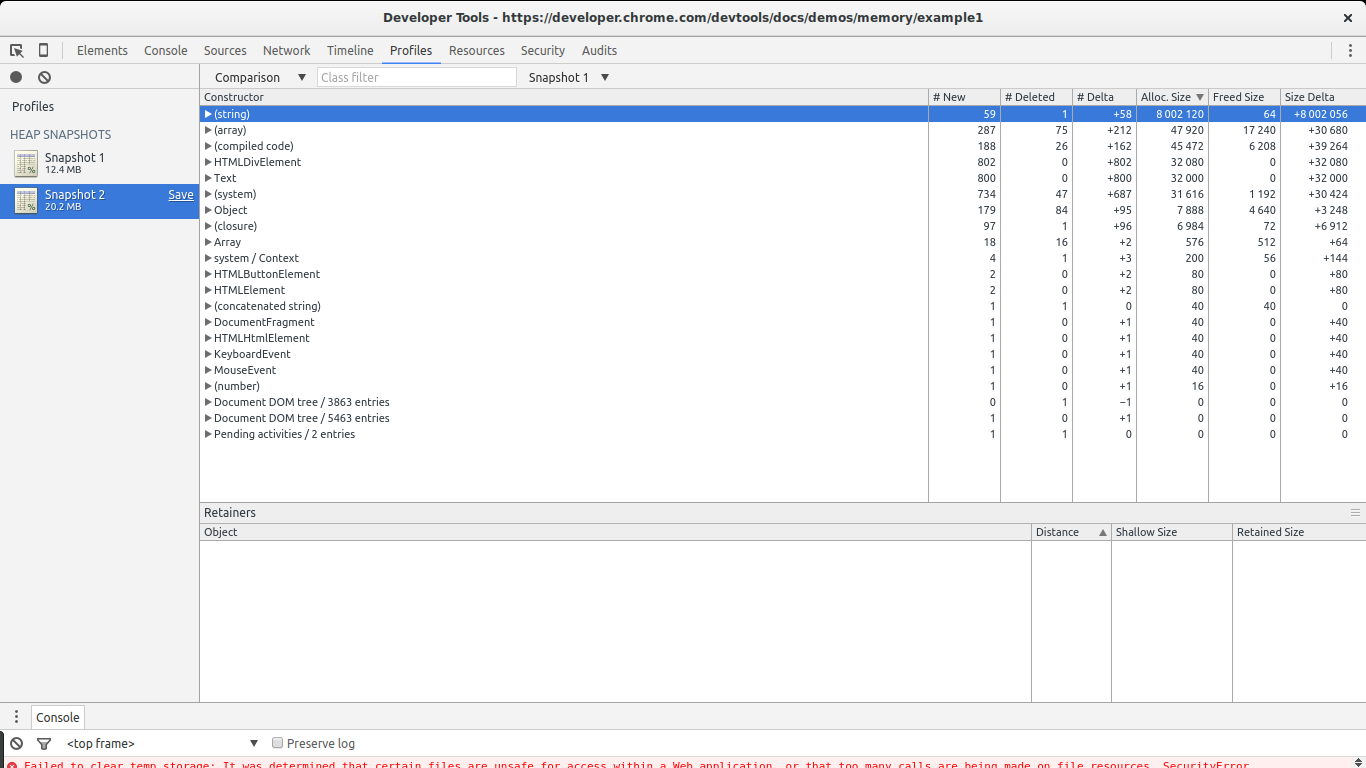
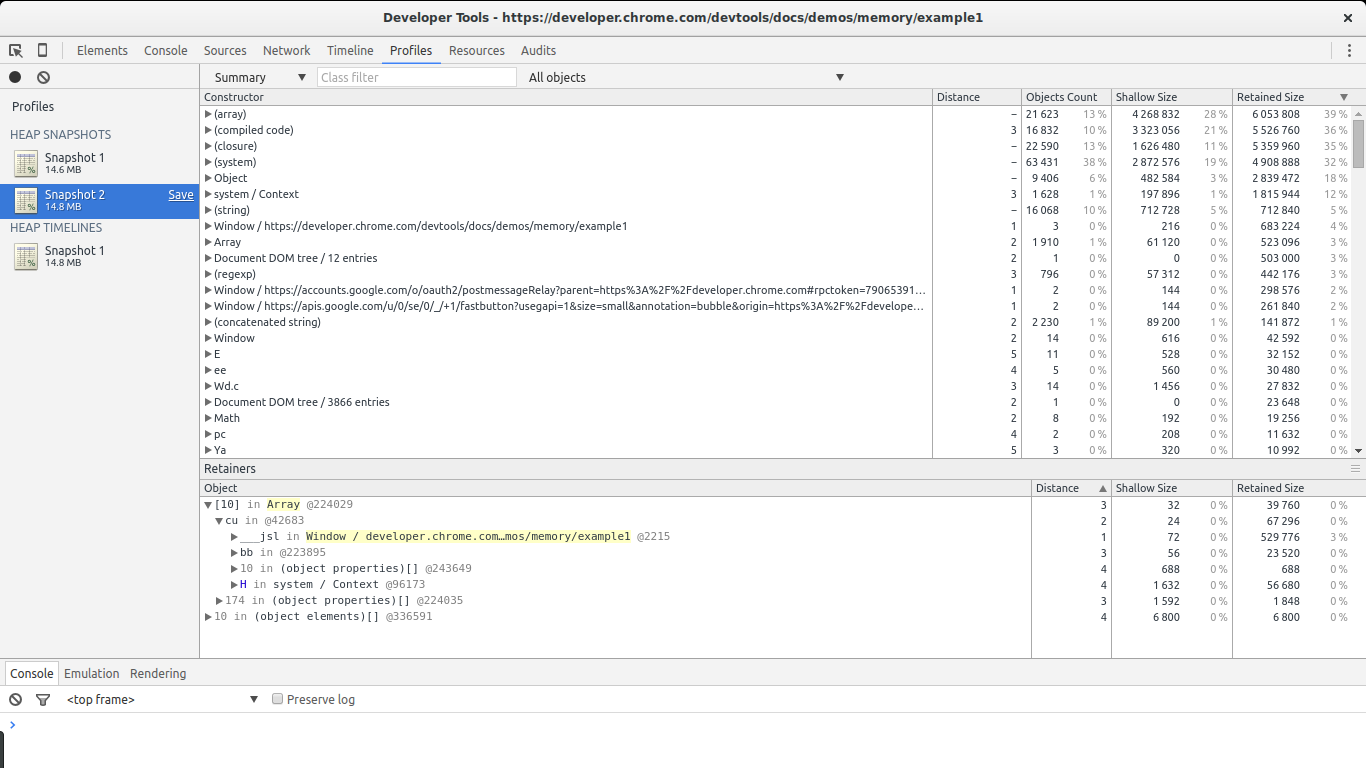
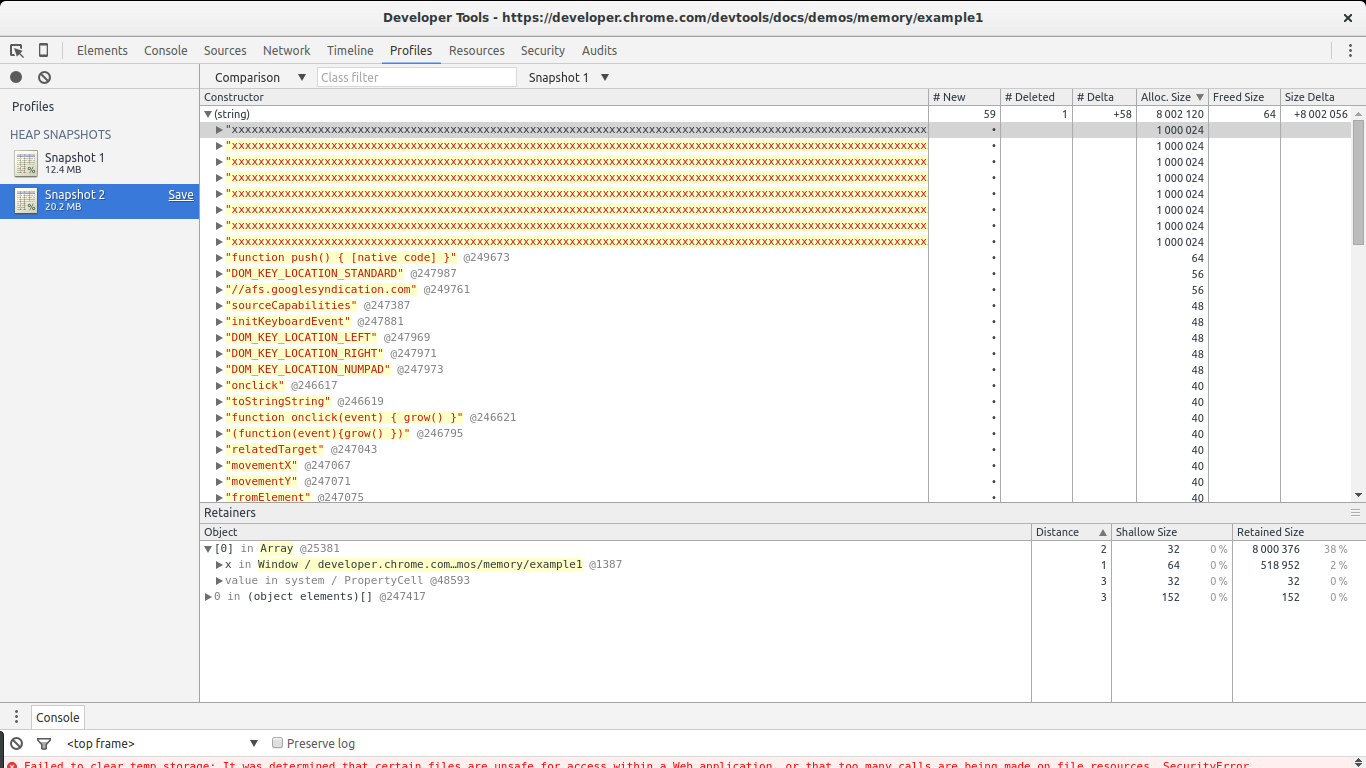
There are two ways to track the spread of memory between two snapshots. You can select Summary and then right-click on Objects allocated between Snapshot 1 and Snapshot 2 or choose Comparison instead of Summary . In both cases, we will see a list of objects that have emerged between the two snapshots.
In this example, it is quite simple to detect leaks: they are large. Pay attention to the Size Delta constructor (string) . 8 MB and 58 new objects. : , , 8 MB.
(string) , . . - , - retainers .
, . , x . , — , . . Fine. — . DOM-, . , . Chrome , — Record Heap Allocations .
Record Heap Allocations
, , . . Record Allocation Timeline . , . . , ( , Chrome ).
, : , . . : ( (string) ), — DOM-, — Text ( DOM-).
HTMLDivElement Allocation stack .
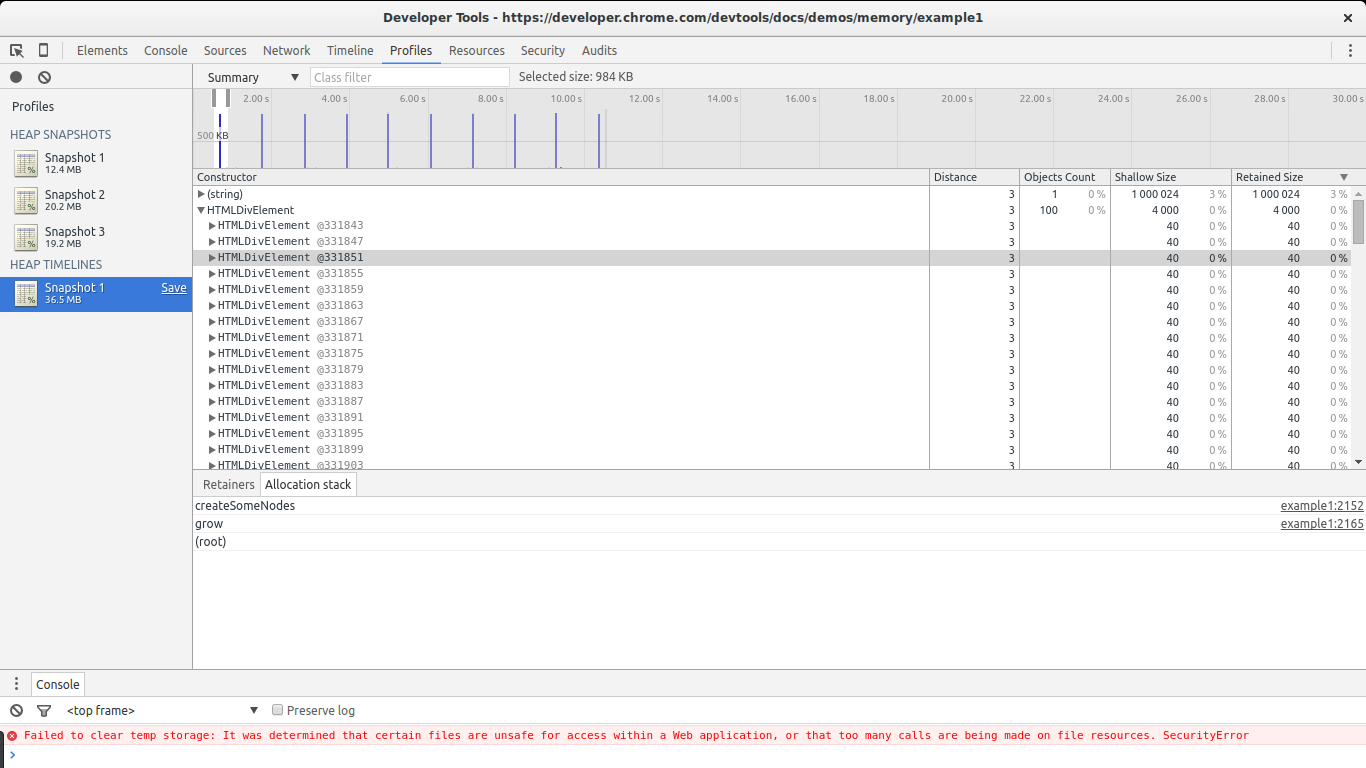
Bingo! , ( grow -> createSomeNodes ). , , HTMLDivElement . , , , . , , . . , , ( createSomeNodes ). .
: , Dev Tools -> Settings "record heap allocation stack traces" .
Allocation Summary :
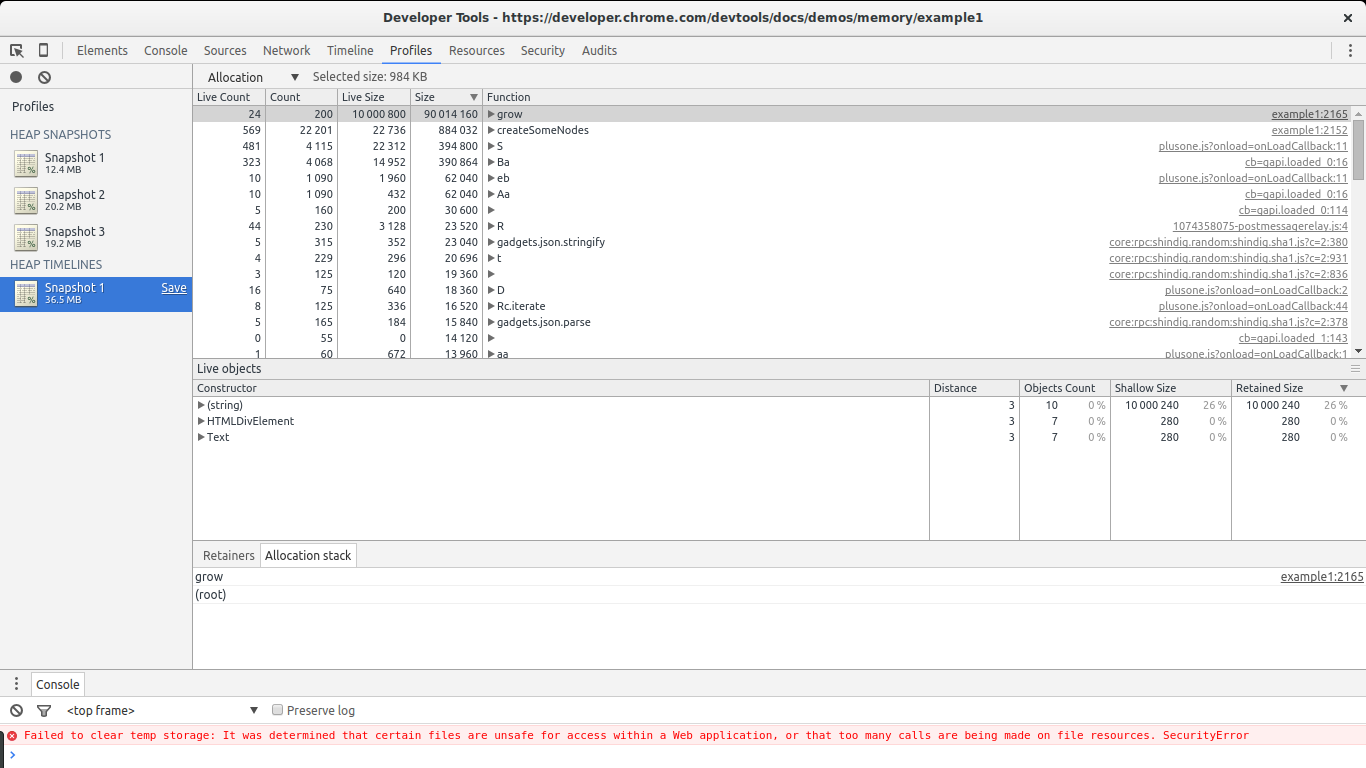
. grow createSomeNodes . grow , . (string) , HTMLDivElement Text , , , .
. Use them. ( ). , , , , ( ).
Additional materials
Memory Management — Mozilla Developer Network
JScript Memory Leaks — Douglas Crockford (old, in relation to Internet Explorer 6 leaks)
JavaScript Memory Profiling — Chrome Developer Docs
Memory Diagnosis — Google Developers
An Interesting Kind of JavaScript Memory Leak — Meteor blog
Grokking V8 closures
Conclusion
, , JavaScript, . , . , . . , . , .
: 4 Types of Memory Leaks in JavaScript and How to Get Rid Of Them , : Sebastián Peyrott .
')
Source: https://habr.com/ru/post/309318/
All Articles