Why prioritization for effort and value does not work
And why is it still worth using it
The article tells why the most popular way to prioritize backlog is not as good as people think, and what can be done to improve it.
Evaluation of labor costs for development and values (returns from labor costs) is the main element of prioritization in the product backlog: this is a simple, understandable approach, and therefore very popular. You probably have 2 such columns in the product backlog (and even if not, then you should add them):

Columns: Feature / Project, Labor, Value.
Content in cells in the first column:
Community tab
Update Feed Stream
Add PayPal Billing
Correct the error in the receipt
Contact with the manager
Update Terms of Service
Work can be specified in person-weeks or simply determined by the level of complexity of the task (simple / light / complex). As soon as you have the numbers, it becomes important to choose those features that will provide the greatest financial return. But then everything becomes more complicated. In order to understand why, let's arrange our tasks in a rectangular coordinate system:
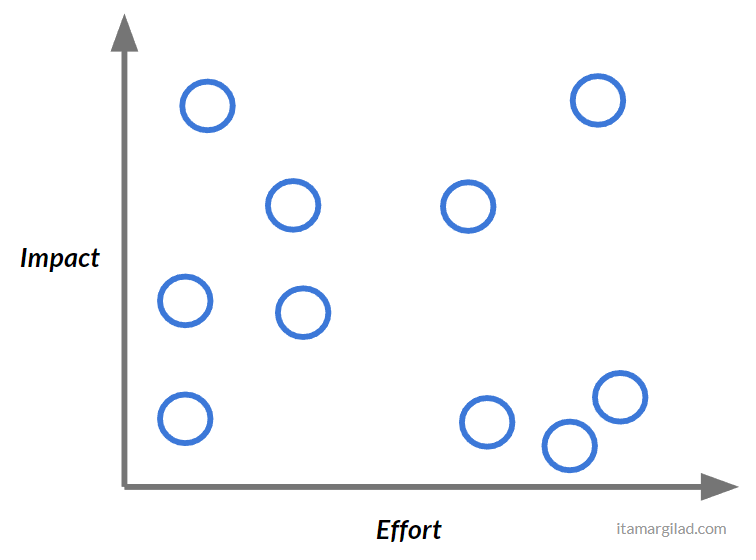
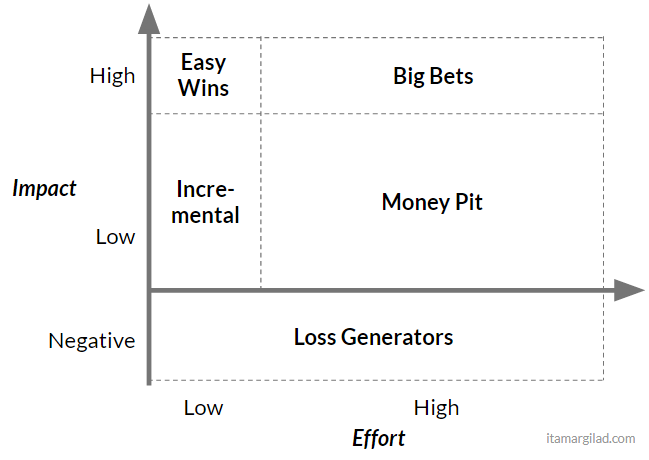
On the x axis, labor costs are located, on Y - the value
It is quite obvious that the top left projects are better than all the others, and the bottom right ones are the worst. But how to compare everything else? Fortunately, a solution exists. You may already be familiar with the matrix of labor costs and values . If you google, you can find thousands of different variations of the matrix - it has long been the best practice in the industry.
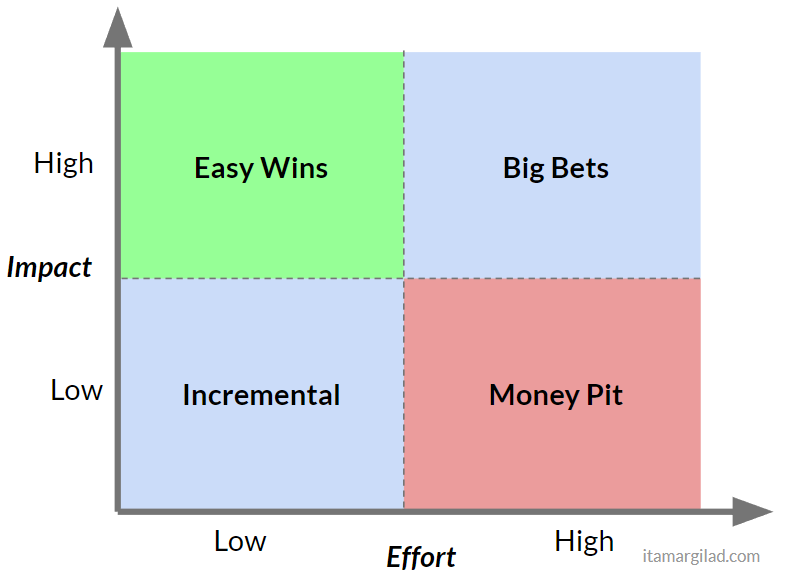
On the X axis: low labor costs - incremental improvements, large labor costs - “money pit” (approx. Lane: in other sources “time eaters”).
On the Y axis: low labor costs - easy victories, large labor costs - big victories.
The idea is very simple - the division into quadrants helps to see how the projects are located.
The “Little / Little” quadrant in the lower left corner contains minor minor product improvements. Each product backlog includes many tasks of this type and all of them play an important role in filling downtime, but at the same time have a low priority.
On the other hand, the “Many / Many” quadrant covers large projects that promise high returns. Many ambitious teams like to bet on such projects.
The most desirable projects that combine low labor costs and high returns in the upper left corner - no one will give up the easy win (and who knows, maybe one of these projects will be the next button to earn $ 300 million ... ).
And, finally, the lower right quadrant - great effort and low return - the so-called money pit, ungrateful tasks, a suitcase without a handle. Certainly no one wants to spend the already limited resources to create things that require a lot of work and have very little value.
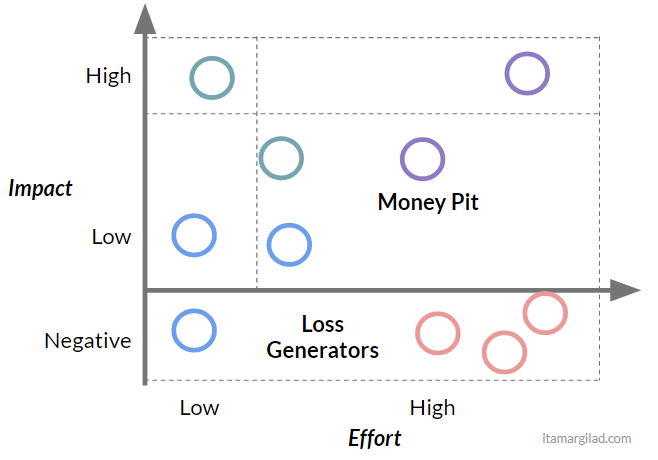
The imposition of our plans on this matrix allows you to quickly get a clear picture:
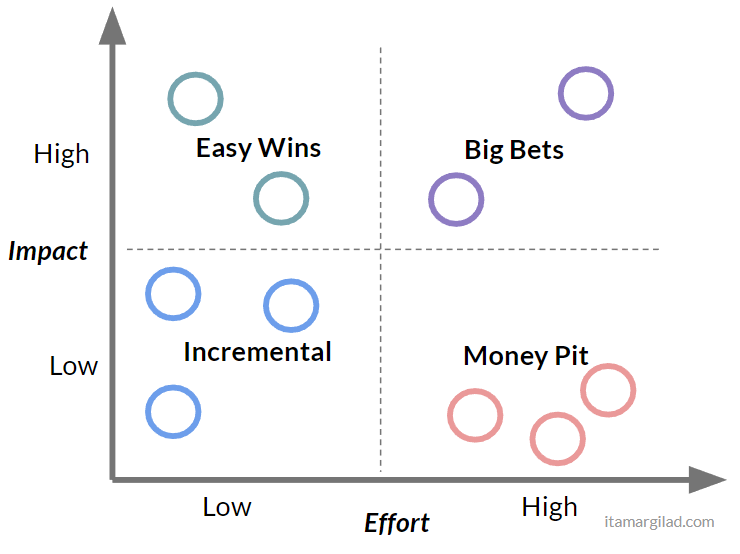
... and now prioritization is pretty simple:
- First, get rid of everything that is in the quadrant of the money pit (this is a good deliverance).
- Then we set light priority to high priority.
- And at the end we form a mix of incremental improvements and high stakes, based on the resources available and our appetites.

Pretty simple?
Not so fast…
As obvious as the above, the problem lies in the fact that prioritizing according to the method of labor cost and value forces us to choose the wrong “winners”. First of all, because this method assumes the need to give an assessment based on the prediction of future events - the efforts that will be required to accomplish the task, and the benefits that will be brought to users as a result of these efforts. As already known, people are very bad at predicting.
A tendency to underestimate the effort
In 1979, behavioral psychologists Daniel Kaneman and Amos Tversky described a phenomenon that they called a planning error . They showed that people and teams regularly are overly optimistic in estimating the time it takes to complete a task, which ultimately underestimate the assessment. This phenomenon has also been confirmed in many other studies.
If you work in IT, then this news is not a shocking discovery for you. Tasks and projects are constantly delayed and the difference from the original plan can go up to 2-3 times (and sometimes much more). Experienced team leaders and project managers prefer to plan time with a margin, they add buffers or simply multiply the estimate by 2, but even with this in mind, projects still do not complete on time and moreover do not complete ahead of time ( example ).
The reasons for this are some features, most of which are different cognitive distortions:
- Optimism and thoughts about the desired.
- Inaccurate memories of how much time was required for a similar task in the past.
- Excessive focus on task completion.
- The underestimation of the influence of the case.
- The scale of the tasks - the larger the project, the lower the accuracy of the estimated duration.
Propensity to overestimate returns
In 2003, Kahneman and Lovallo expanded the definition of a planning error, including the tendency to underestimate the time, cost, and risks of future actions and at the same time overestimate the benefits of those same actions. In other words, problems in planning projects are associated not only with time overruns, but also with cost overruns and a lack of bottom line benefits.
In the technical field, we are particularly naive about this. Time after time, I see managers and teams who believe their estimates of future benefits based on “liver flair”, no matter how good previous predictions turned out to be. The two main factors contributing to this are:
- There are no clear metrics - often the answer to the question of whether a project is successful is formed from the interpretation of results, because success criteria were not defined in advance.
- We tend to remember our lucky predictions and forget the bad ones (or attribute them to others).
As soon as you begin to systematically measure success and failure, a clear picture of how badly we can predict exhaust appears. An independent analysis of A / B experiments conducted by Microsoft, Netflix and Booking, demonstrated that at best, only 1 out of 3 ideas tested showed a positive, measurable result. The rest of the studied ideas either did not give a result at all, or it was negative. But these figures do not reflect the situation of the entire industry. One winning idea of the three is a very good result, possible only with mature products and companies that have spent a large amount of time researching their users and customers. A startup will be closer to a 1:10 ratio (or even worse), and slightly more mature companies can expect better performance.
“It is humiliating to see how badly experts (including us) assess the value of features. Each feature created by the development team is created because someone believes that it will have value, but many of the advantages fall when confronted with reality. ”
From a Microsoft study , 2009
John T. Gurvil of Harvard Business School in his 2006 research article described a strong discrepancy between the value companies expect to provide to consumers as a result of innovation and how consumers see this value. According to Gurvil’s research, companies tend to overestimate the benefits of a product, while users see much more value in an already used solution and overestimate the cost of switching to a new solution. According to Gurvil, companies overestimate the value of 9 times.
Let's return to the “Labor / Value” matrix
So, projects usually cost much more than we think and in the eyes of users are less valuable than we think.
Looking back at the matrix, it becomes clear to us that in fact the situation is as follows:
Yes, with the greatest probability, you will get into the zone of the money pit.
But still worse. As the result of the analysis of A / B tests shows, some projects have a negative result - this is something that almost no development team takes into account. Thus, there is an element of risk that is not disclosed in this matrix.
The real “Cost / Value” matrix looks something like this:
On the Y axis below zero - negative, loss generator.
If we impose our projects on the updated matrix, we get a new, much less optimistic picture - some projects that used to relate to big victories now ended up in a money pit:
I think this is a good moment to say goodbye to the “Labor / Value” matrix. This model is too simplified and suggests that with some degree of confidence one can say in advance how much the development will cost and how much a positive effect the new feature will have. If there was a matrix of a real situation (and I think it does not exist), then it would probably look like this:
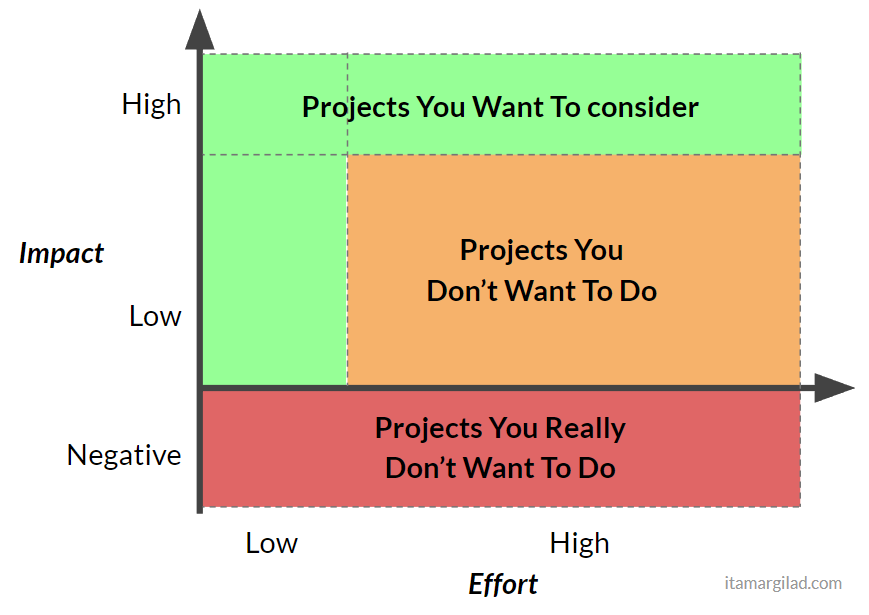
Green - projects that you want to consider.
Orange - projects that you do not want to do.
Red - projects you don't really want to do.
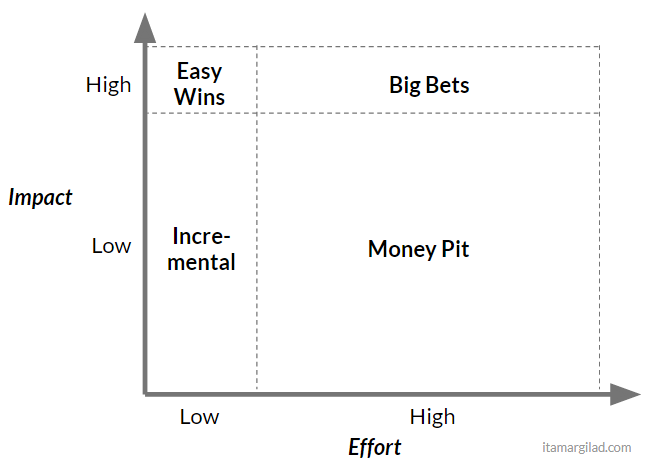
5 steps to make the “Labor / Value” matrix viable
First, you need to realize that 60-90% of the projects in your backlog are useless - they simply will not give at least any significant result or will cost much more than you are willing to pay for them. Prioritization and experimentation are needed in order to find those diamonds that will still bring benefits (they will also be implemented with a delay in terms, but this is normal).
Secondly, I still am a supporter of the matrix “Labor costs / value” and I consider it very convenient. In fact, I often recommend it to companies I work with. However, I also encourage efforts to slightly improve this prioritization approach.
Count return on napkin
Usually you can significantly increase the accuracy of calculations, if you divide the task into parts and evaluate these parts separately. My favorite example is marketing campaigns that are based on sending emails or promotions within the product. They almost always promise an improvement in conversion or an increase in revenue by “10%”, but if you consider how the funnels will work in reality - how many people see the promo, what percentage will click, how many of those clicked will convert - it is likely that the resulting number will not “10%”, and will be reduced to fractions of percent. Yes, an error of two orders of magnitude can be seen in less than two minutes.
Use available data or new data
Often, the data that we already collect can quickly tell how valuable a new feature or project can be - usually by comparing it with something very similar that it has already been launched.
For example, past promotions may suggest which CTR can be expected for a new promo. In any features or projects, a significant amount of work may be required, so it is useful to add events and counters to collect missing data that can help with the assessment.
Think of cheap ways to test your hypotheses.
For large projects it is often useful to conduct preliminary research:
- Polls
- Smok tests - for example, the advertising campaign on Facebook "fake door"
- User Interviews
- MVP
All these studies are not necessarily carried out for each feature, because they are difficult to scale.
Confidence interval
Now that you know what effect underestimation of labor costs and overestimation of value can have, you may want to add an additional column “Trust” to your food backlog to take into account how confident you are in the calculations.
A very low level of trust may be 0.1, a very high level of 0.8 (more information about calculating the level of trust here ).
The formula for calculating the priority is now this:
A / B tests
A / B tests destroy almost all guesses and eliminate most of the risks. If you are testing a feature before launching, you do not need to rely on premonitions and intuition - you will see enough whether the idea is successful or not. A / B testing allows you to make bets with relatively low risk. For this reason, companies like Netflix are testing everything , both small and big changes.
')
Source: https://habr.com/ru/post/419349/
All Articles