Report of the Information Security Monitoring Center for the II half of 2017
From the beginning of 2018, we are switching to a semi-annual cycle of publishing reports of the Monitoring Center of our company. This report covers the period from July to December 2017.
Under the cut on why there are fewer events, and more incidents.
')
An information security event is an identified occurrence of a certain state of a system, service, or network indicating a potential violation of the information security policy or the failure of protective measures, or the occurrence of a previously unknown situation that may be related to security.
An information security incident is the occurrence of one or more unwanted or unexpected security events that are associated with a significant likelihood of business operations being compromised and creating an information security threat.
The event sources are network and host IDS, network devices, security scanners, anti-virus solutions and honeypots.
As part of internal processing, we classify incidents according to the resources affected.
An analyst at the Monitoring Center arbitrarily determines the degree of criticality if he believes that an incident can lead to serious negative consequences.
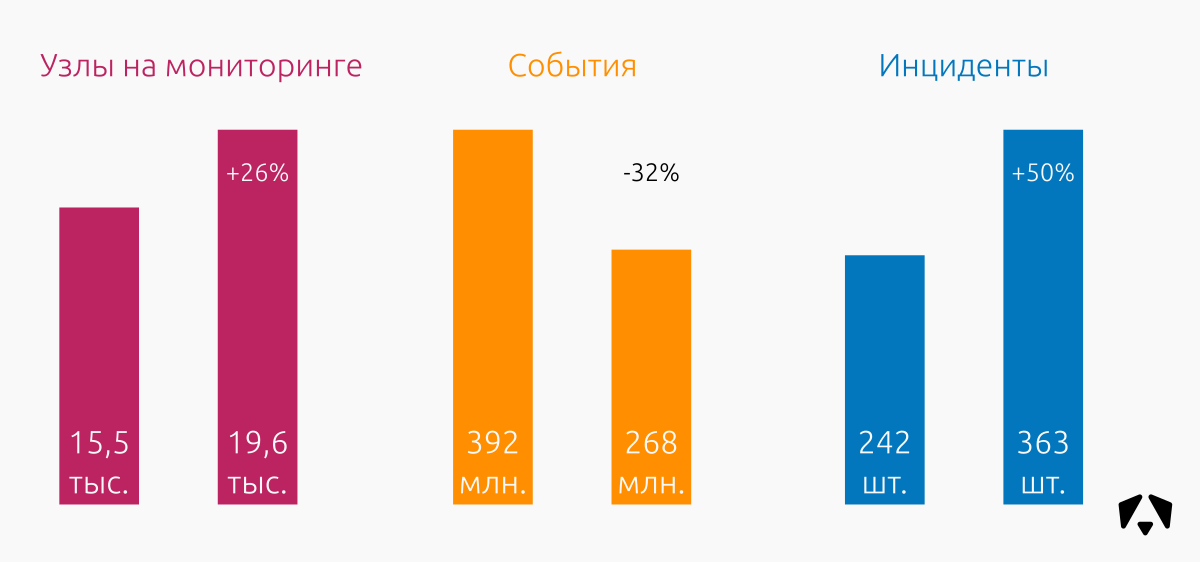
In the period from July 1 to December 31, 2017, employees of the Monitoring Center monitored information systems of organizations with a total number of connected nodes of about 19,600 (workstations, web, mail, file storage, VPN, etc.). Due to the growing interest in the creation and operation of information security monitoring centers, in the second half of 2017 we were able to attract new regular customers and launch several pilot projects.
In six months, sensors recorded 268 million information security events and identified 363 incidents .
For comparison, in the first half of 2017, the Monitoring Center recorded 392 million IS events and 242 incidents .
Judging by the picture above, we see a noticeable decrease in the number of recorded events. At first glance, this is somewhat paradoxical, because it is obvious that the more nodes and customers, the more traffic and, therefore, there should be more events. Associated with a decrease in the number of events with two reasons.
The first reason - our sensors began to work better. Or rather, we began to do better work on errors and modify sensors. Since we ourselves develop attack detection rules for IDS (network and host level), we have the opportunity to upgrade them promptly.
The second reason is the accumulation of experience in responding to incidents by responsible employees of customers. The longer we interact with IT and IS administrators, the more worked their response and containment actions become, the faster the attack or anomaly stops. As a result, we get fewer events.
The 50% increase in the number of incidents compared to the first half of 2017 was caused by the fact that new customers were actively connected to the Monitoring Center. A new monitoring infrastructure is almost guaranteed a surge in the number of detected incidents that the owner of the infrastructure previously simply could not notice. It is necessary to deal with this "new peak", and the number of recorded incidents is sharply reduced.
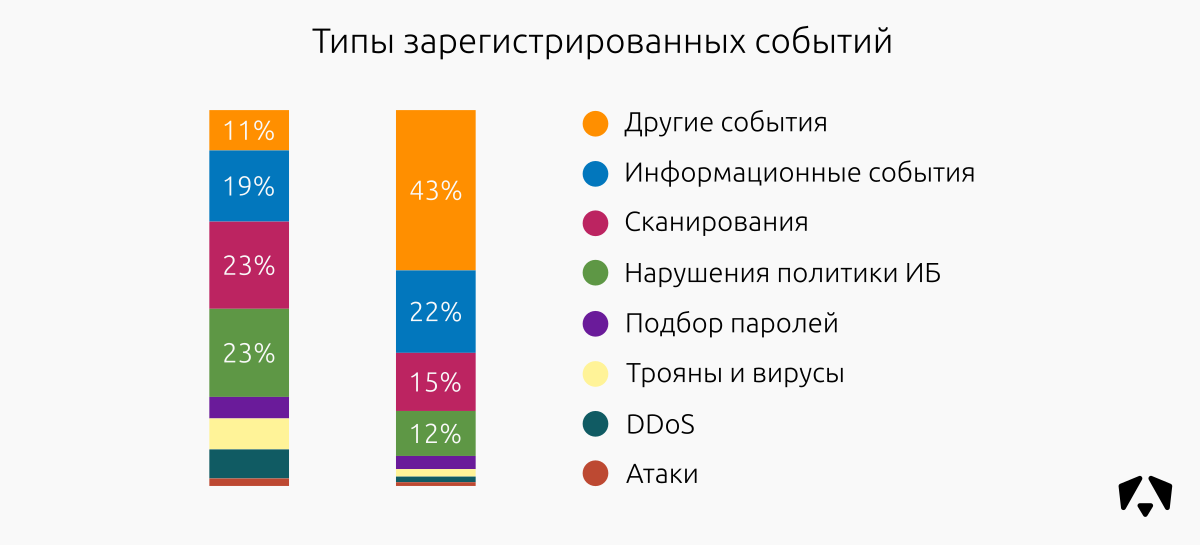
The distribution of recorded events by type has not changed much compared with the first half of 2017. Informational events, attempts to scan and violation of information security policies prevail.
The most noticeable difference - a significant increase in so-called. "Other Events". Since in the second half of the year they accounted for 43% of all recorded, we considered it necessary to explain in detail why this happened.
According to our current classification, “Other events” are mostly events that signal anomalies in network traffic, which are related to:
An example is the case with which many "other" events were associated. We connected a new network segment for monitoring. Everything is standard - on the very first day, most obvious problems were sorted out. In the middle of the night, for a short period of time, the sensors generated a huge number of events on anomalous traffic. While they were sorting out what had happened, and communicating with the owner of the infrastructure, the outburst repeated, but in the morning. Everyone is worried, the sensor is choking on events, those responsible for monitoring this infrastructure “blush, turn pale and sweat a lot ...” Finally, the infrastructure owner reports that the traffic was between the address of the surveillance camera and the terminal server. It turned out that the guards regularly looked through the recordings of surveillance cameras, and the sensor, unaware of such traffic, “screamed” about the terrible anomaly on the network. Well, they wiped away tears, trained and tuned the sensor, and continued monitoring.
Another problem that is usually not immediately able to cope with is the activity of self-written or rare application software in the internal network. Network sensors simply do not know what kind of traffic, until we finalize the set of rules.
Among the identified 363 incidents :
In the largest class of “malware”, we observed the following trends:
As for the "Exploitation of Vulnerabilities", we, in addition to the usual exploitation of EternalBlue, can separately distinguish a large attempt to exploit vulnerabilities on the Web, and especially in Apache Struts , which exploits fell into the Metasploit set in the reporting period.
Distribution of IS incidents relative to the days of the week in the second half of 2017:
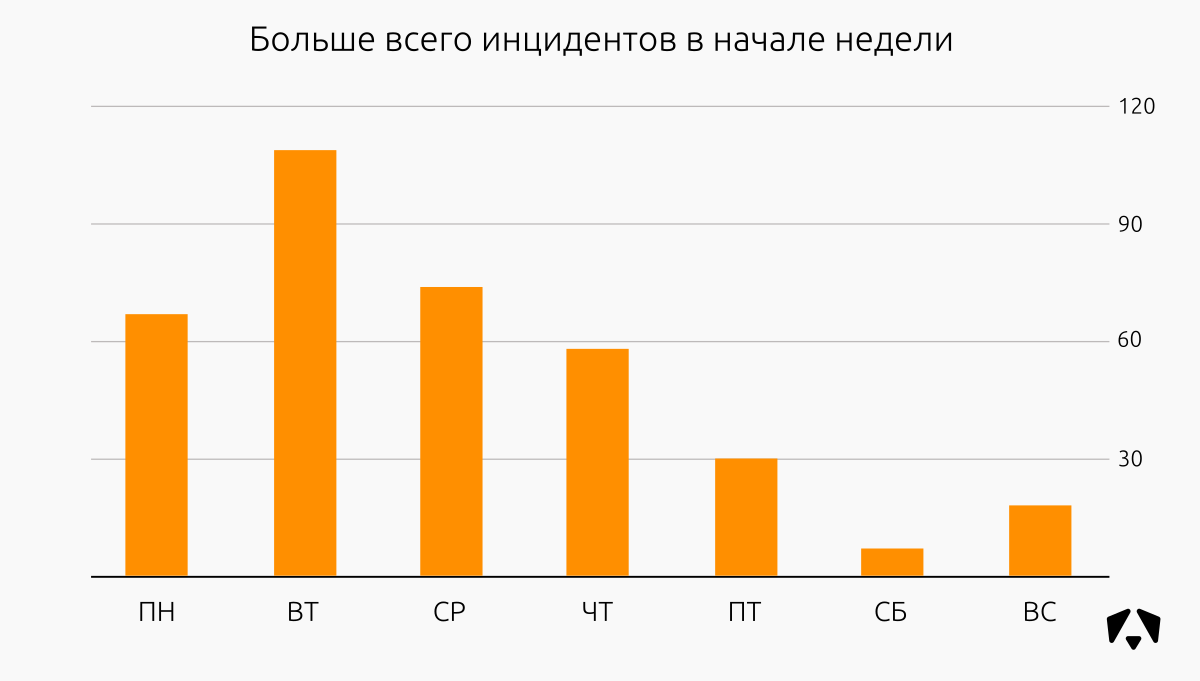
As a rule, we begin to provide monitoring services for new customers from the beginning of the week (statistics are inexplicable, most likely working as standard “From Monday, I will definitely start to lose weight / run / swing / read / monitor”), so the peaks of incidents are clear and predictable. On Monday - Tuesday, events begin to arrive at the Monitoring Center, we identify incidents and help deal with them.
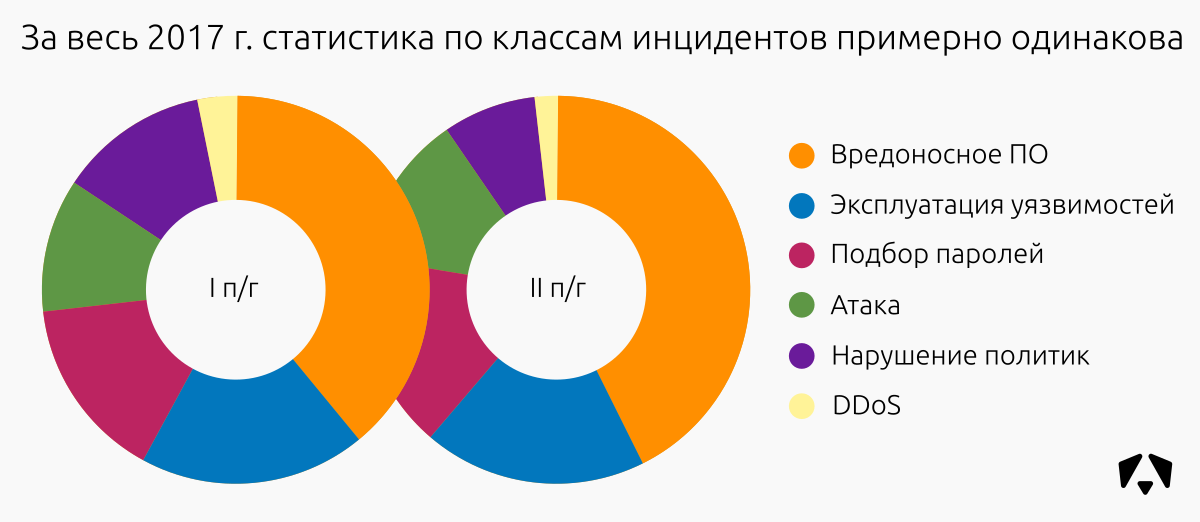
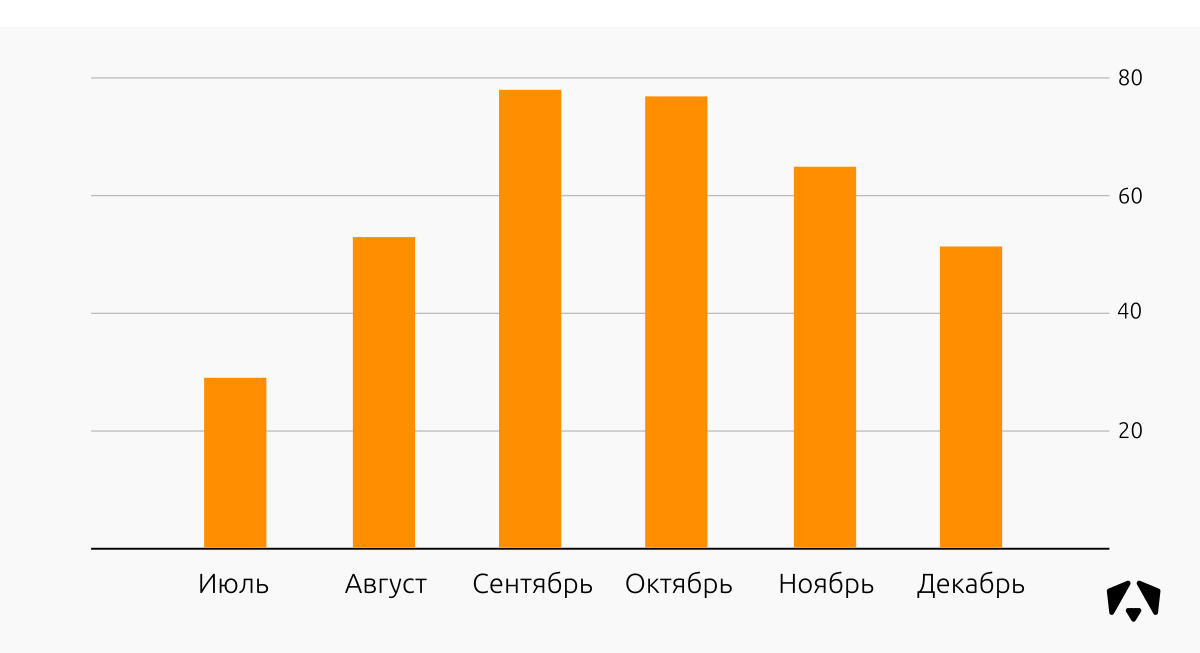
Distribution of information security incidents in the second half of 2017:
No matter how much we want to explain the tendency of just such a distribution of detected incidents, we could not find such a connection to link them to the periods when new information systems were connected to monitoring, explain it on the basis of news in the field of information security.
The sources of attacks in this case are IP-addresses that were participants in the network interaction with controlled addresses.
The map shows the location of the first hundred IP addresses by the number of registered events. Most of these addresses are located in Russia, Ireland (the newcomer to our reports, all addresses belong to Amazon), Germany and the Netherlands.
In the second half of the year (as well as in the second quarter) of 2017, web segments were also often attacked as user workstations. In total, these are two thirds of all attacks against controlled resources. These are fairly obvious and quite accessible from external networks.
The main types of attacks on the web - brute force and attempts to exploit vulnerabilities, including the Apache web server, as we wrote above. On user workstation - malware, attempts to exploit vulnerabilities in browsers.
Report for the first quarter of 2017 .
Report for the II quarter of 2017 .
"Confrontation" PHDays or what we were called the "All-Seeing Eye" . On Cow - me.
CM services
Under the cut on why there are fewer events, and more incidents.
')
What and how we consider
An information security event is an identified occurrence of a certain state of a system, service, or network indicating a potential violation of the information security policy or the failure of protective measures, or the occurrence of a previously unknown situation that may be related to security.
An information security incident is the occurrence of one or more unwanted or unexpected security events that are associated with a significant likelihood of business operations being compromised and creating an information security threat.
The event sources are network and host IDS, network devices, security scanners, anti-virus solutions and honeypots.
As part of internal processing, we classify incidents according to the resources affected.
| High criticality | Incidents related to key server segment resources or critical user segment resources (resources that handle critical information from a business, financial, or legal point of view). |
| Average criticality | Incidents related to non-critical server segment resources. |
| Low criticality | Incidents related to non-critical resources of the user segment (ordinary user). |
An analyst at the Monitoring Center arbitrarily determines the degree of criticality if he believes that an incident can lead to serious negative consequences.
Monitoring results
In the period from July 1 to December 31, 2017, employees of the Monitoring Center monitored information systems of organizations with a total number of connected nodes of about 19,600 (workstations, web, mail, file storage, VPN, etc.). Due to the growing interest in the creation and operation of information security monitoring centers, in the second half of 2017 we were able to attract new regular customers and launch several pilot projects.
In six months, sensors recorded 268 million information security events and identified 363 incidents .
For comparison, in the first half of 2017, the Monitoring Center recorded 392 million IS events and 242 incidents .
Judging by the picture above, we see a noticeable decrease in the number of recorded events. At first glance, this is somewhat paradoxical, because it is obvious that the more nodes and customers, the more traffic and, therefore, there should be more events. Associated with a decrease in the number of events with two reasons.
The first reason - our sensors began to work better. Or rather, we began to do better work on errors and modify sensors. Since we ourselves develop attack detection rules for IDS (network and host level), we have the opportunity to upgrade them promptly.
For example, employees of the duty shift of the monitoring center see the triggering of a certain rule by the customer. If this is clearly a false actuation of the remedies for legal activity or correct triggering, but the protector generates a very large number of identical messages, then the duty shift creates an application for refining the rules. Signature analysts take this application to work, understand the situation and either make corrections to these rules, or make so that these numerous alerts "stuck together" into one. The next time the sensor is updated, the flow of recorded events will decrease.
The second reason is the accumulation of experience in responding to incidents by responsible employees of customers. The longer we interact with IT and IS administrators, the more worked their response and containment actions become, the faster the attack or anomaly stops. As a result, we get fewer events.
The 50% increase in the number of incidents compared to the first half of 2017 was caused by the fact that new customers were actively connected to the Monitoring Center. A new monitoring infrastructure is almost guaranteed a surge in the number of detected incidents that the owner of the infrastructure previously simply could not notice. It is necessary to deal with this "new peak", and the number of recorded incidents is sharply reduced.
Description of event types
“Informational event” - informational events that may be useful in the analysis of an incident.
“Violation of the IS policy” - events that indicate actions that allegedly violate the requirements of the IS Policy of a controlled organization.
“Attack or exploitation” - events that indicate attempts to remotely execute a code or exploit vulnerabilities in controlled resources.
"Scan" - events that indicate the study of the network before attempting an attack.
“Password Selection” - events that indicate attempts to gain access to monitored resources by selecting authentication data.
"Trojans and viruses" - events that indicate the fact of infection of controlled resources with viruses or malware activity.
“DDoS” - events that indicate attempts to carry out distributed denial of service attacks.
The distribution of recorded events by type has not changed much compared with the first half of 2017. Informational events, attempts to scan and violation of information security policies prevail.
The most noticeable difference - a significant increase in so-called. "Other Events". Since in the second half of the year they accounted for 43% of all recorded, we considered it necessary to explain in detail why this happened.
According to our current classification, “Other events” are mostly events that signal anomalies in network traffic, which are related to:
- incorrect configuration of the network infrastructure ("It seems to work, well, well!");
- the specifics of the network equipment.
An example is the case with which many "other" events were associated. We connected a new network segment for monitoring. Everything is standard - on the very first day, most obvious problems were sorted out. In the middle of the night, for a short period of time, the sensors generated a huge number of events on anomalous traffic. While they were sorting out what had happened, and communicating with the owner of the infrastructure, the outburst repeated, but in the morning. Everyone is worried, the sensor is choking on events, those responsible for monitoring this infrastructure “blush, turn pale and sweat a lot ...” Finally, the infrastructure owner reports that the traffic was between the address of the surveillance camera and the terminal server. It turned out that the guards regularly looked through the recordings of surveillance cameras, and the sensor, unaware of such traffic, “screamed” about the terrible anomaly on the network. Well, they wiped away tears, trained and tuned the sensor, and continued monitoring.
Another problem that is usually not immediately able to cope with is the activity of self-written or rare application software in the internal network. Network sensors simply do not know what kind of traffic, until we finalize the set of rules.
Some more statistics
Among the identified 363 incidents :
| Incident class | High criticality | Average criticality | Low criticality | Total incidents | Share of incidents |
|---|---|---|---|---|---|
| Malicious software | 59 | 29 | 66 | 154 | 42% |
| Vulnerability Exploitation | 33 | nineteen | sixteen | 68 | nineteen% |
| Password Selection | 26 | 23 | ten | 59 | sixteen% |
| Attack | ten | 26 | eleven | 47 | 13% |
| Violation of information security policy | eleven | 9 | eight | 28 | eight% |
| DDoS | four | 3 | 0 | 7 | 2% |
| Total: | 143 | 109 | 111 | 363 | 100% |
In the largest class of “malware”, we observed the following trends:
- The more nodes on the monitoring - the more incidents with the malware (the
captaincy isobvious). - As in the second quarter of 2017, infections with the WannaCry and Petya / notPetya malware families continue.
- We are faced with a new type of malware, which uses WannaCry components. It does not encrypt data, but spreads across the network, infecting affected nodes by EternalBlue. After that, "knocking" out. If the infection attempt succeeds, it means that the machine is potentially vulnerable, which is extremely unpleasant.
- Increasingly, we find malware for mining cryptocurrency.
As for the "Exploitation of Vulnerabilities", we, in addition to the usual exploitation of EternalBlue, can separately distinguish a large attempt to exploit vulnerabilities on the Web, and especially in Apache Struts , which exploits fell into the Metasploit set in the reporting period.
Distribution of IS incidents relative to the days of the week in the second half of 2017:
Only here I see a whale?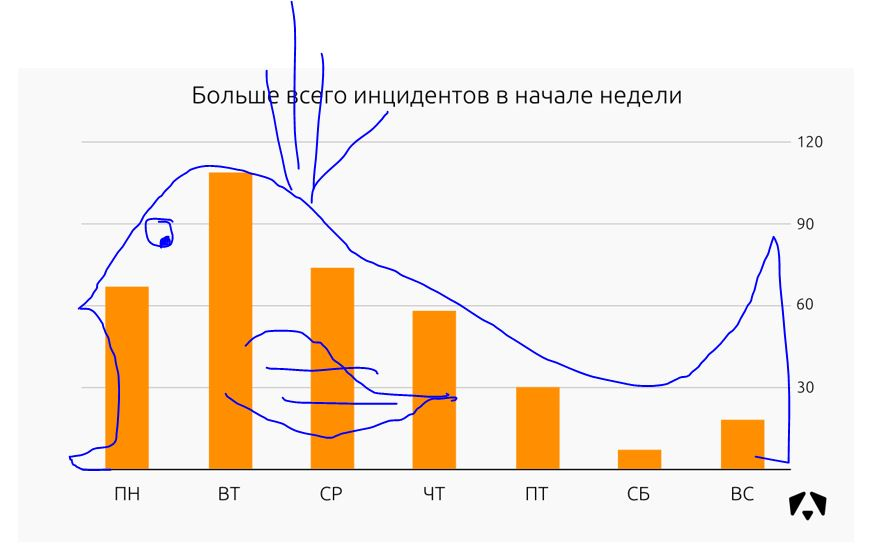
As a rule, we begin to provide monitoring services for new customers from the beginning of the week (statistics are inexplicable, most likely working as standard “From Monday, I will definitely start to lose weight / run / swing / read / monitor”), so the peaks of incidents are clear and predictable. On Monday - Tuesday, events begin to arrive at the Monitoring Center, we identify incidents and help deal with them.
Distribution of information security incidents in the second half of 2017:
No matter how much we want to explain the tendency of just such a distribution of detected incidents, we could not find such a connection to link them to the periods when new information systems were connected to monitoring, explain it on the basis of news in the field of information security.
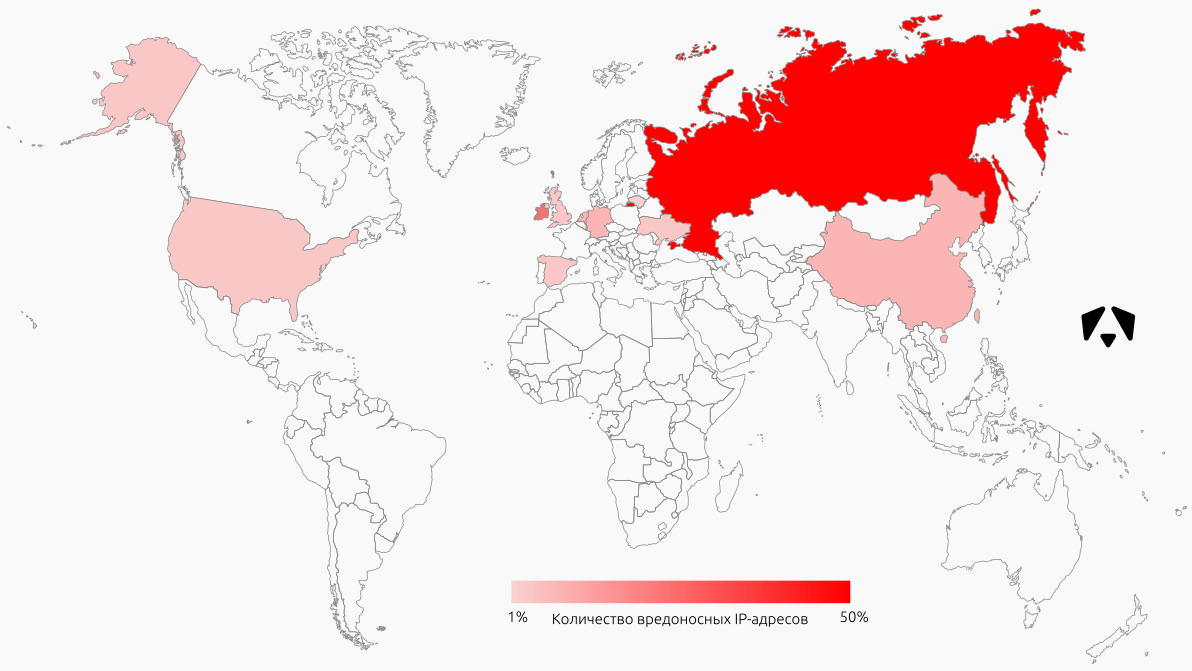
TOP sources
The sources of attacks in this case are IP-addresses that were participants in the network interaction with controlled addresses.
The map shows the location of the first hundred IP addresses by the number of registered events. Most of these addresses are located in Russia, Ireland (the newcomer to our reports, all addresses belong to Amazon), Germany and the Netherlands.
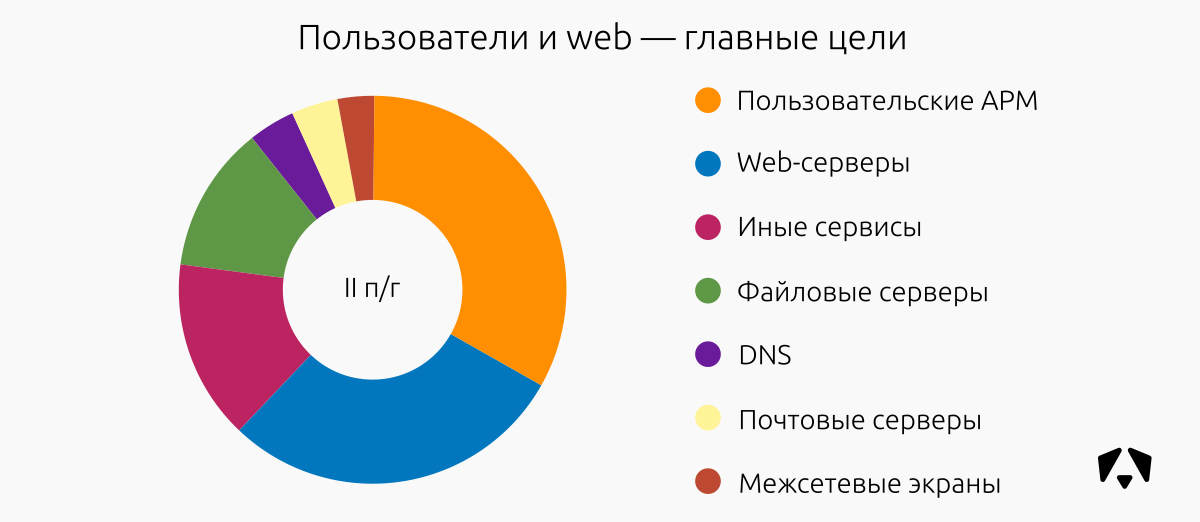
TOP incident-prone segments
In the second half of the year (as well as in the second quarter) of 2017, web segments were also often attacked as user workstations. In total, these are two thirds of all attacks against controlled resources. These are fairly obvious and quite accessible from external networks.
The main types of attacks on the web - brute force and attempts to exploit vulnerabilities, including the Apache web server, as we wrote above. On user workstation - malware, attempts to exploit vulnerabilities in browsers.
Previous reports
Report for the first quarter of 2017 .
Report for the II quarter of 2017 .
"Confrontation" PHDays or what we were called the "All-Seeing Eye" . On Cow - me.
About the Monitoring Center
CM services
Source: https://habr.com/ru/post/349000/
All Articles