Macaw - convenient library for vector graphics in Cocoa
Hi Habr! Modern mobile application interfaces contain tons of illustrations and animations, ranging from sly gradients and ending with stock charts . Therefore, mobile developers have to spend a huge amount of time to turn a beautiful design into a functional application, which, moreover, will work on devices of various sizes.
This is exactly the problem we faced during the development of iOS applications. To simplify the task, we developed the Macaw graphics library, which allows you to describe complex interfaces as clear scene objects and even directly display SVG graphics with support for events and animation.
Interesting? In this article, we will introduce you to the basic concepts of Macaw and together create a chart with animation, using a minimum of code.
Macawview
MacawView is the main class used to display all Macaw graphics in the Cocoa world. To start working with Macaw, we need to create our own class, inherit it from MacawView and describe the necessary interface inside. Since MacawView already implements UIView , the class we created can be easily integrated into the Cocoa interface. This is what the simplest "Hello, World!" Will look like. on Macaw:
class MyView: MacawView { required init?(coder aDecoder: NSCoder) { let text = Text(text: "Hello, World!", place: .move(dx: 145, dy: 100)) super.init(node: text, coder: aDecoder) } } 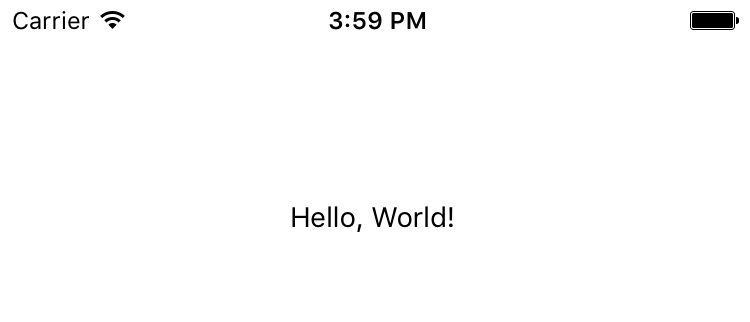
Scene
Macaw describes interfaces as a combination of text, images, and geometric objects. Such a combination is called a scene graph, or simply a scene. Let's go through the main elements of the scene.
Shape
Shape is an element of the scene that represents a geometric shape. This element has three basic properties:
formis the locus of points defining the shape of the shape. With this property, we define what we want to draw: a rectangle, a circle, a polygon, or something else.fill- colors inside the shapestroke- border colors around the shape
Let's look at the simplest rectangle:
class MyView: MacawView { required init?(coder aDecoder: NSCoder) { let shape = Shape(form: Rect(x: 100, y: 75, w: 175, h: 30), fill: Color(val: 0xfcc07c), stroke: Stroke(fill: Color(val: 0xff9e4f), width: 2)) super.init(node: shape, coder: aDecoder) } } 
Macaw uses the standard Cocoa coordinate system , so using the example above, we draw a rectangle of 175x30 pixels in the center of the iPhone 6 / 6s screen (which is 375 pixels wide). To support different screen sizes, we have several options:
- Use
MacawViewfixed size andMacawViewit with Cocoa's autolayout. - Independently calculate the position of the elements of the scene, depending on the screen size. Fortunately, vector graphics scale perfectly to fit any size.
Macaw also supports other geometric primitives:

In addition, Macaw has a Path element that allows you to describe shapes of any complexity as a set of curves.
Let's return to our example. Now let's try to add a round to our rectangle:
let shape = Shape( form: RoundRect( rect: Rect(x: 100, y: 75, w: 175, h: 30), rx: 5, ry: 5), fill: Color(val: 0xfcc07c)) 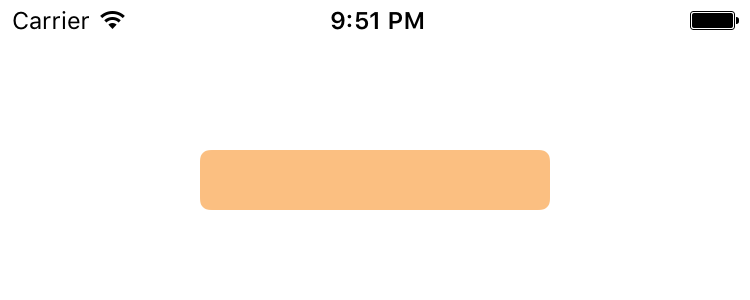
Such a scene description is called declarative. With this approach, we describe the scene, breaking it into a tree of primitives. Macaw also allows you to describe the scene in a functional style. In this case, the example above would look like this:
let shape = Rect(x: 100, y: 75, w: 175, h: 30).round(r: 5).fill(with: Color(val: 0xfcc07c)) You decide which approach is best for each case, but we recommend using one that makes your code more readable.
Text
The next basic element of the scene is the text. Here are its main properties:
text- text to displayfill- text colorfont-fontname and sizealign/baseline- properties responsible for text alignment
class MyView: MacawView { required init?(coder aDecoder: NSCoder) { let text = Text(text: "Sample", font: Font(name: "Serif", size: 72), fill: Color.blue) super.init(node: text, coder: aDecoder) } } 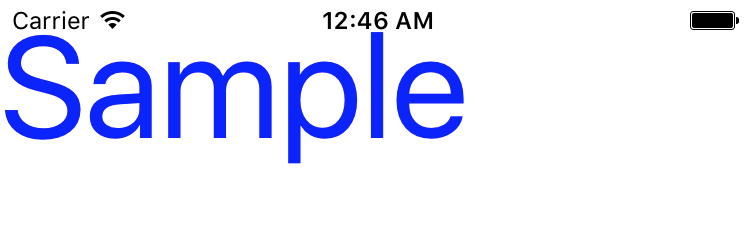
As you can see, the text does not have special properties for the position, unlike Shape . However, each element of the scene has a place property that allows you to position the scene element relative to its parent, or even rotate and resize it. We will return to this property later, but for now let's just add the following line:
text.place = .move(dx: 100, dy: 75) 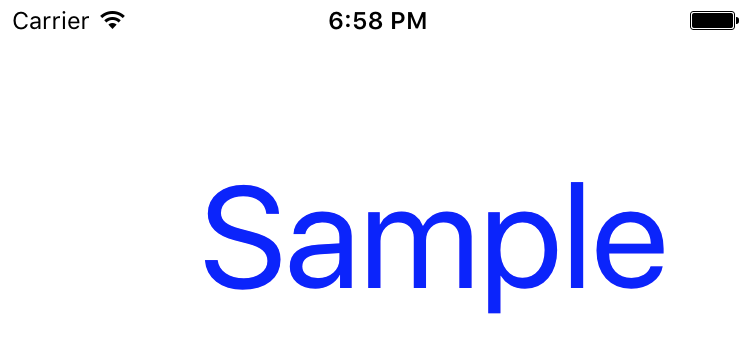
By default, the text is relative to the upper left corner. To center the text, we can use the align property:
text.place = .move(dx: 375 / 2, dy: 75) text.align = .mid 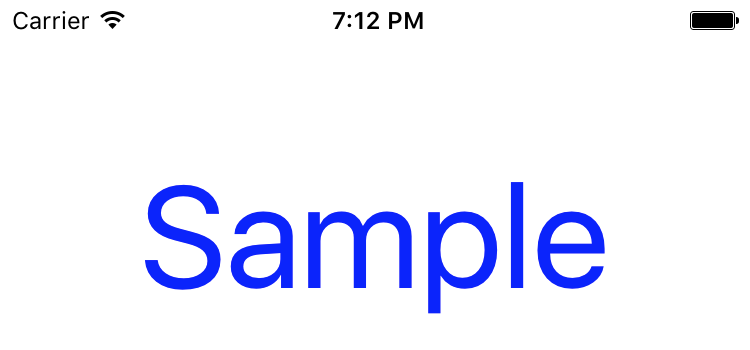
For vertical centering, we can also use the baseline property.
Group
Now you can go to the combination of elements. The most important property of a group is contents : a list of the elements that make up the group:
class MyView: MacawView { required init?(coder aDecoder: NSCoder) { let shape = Shape( form: Rect(x: -100, y: -15, w: 200, h: 30).round(r: 3), fill: Color(val: 0xff9e4f), place: .move(dx: 375 / 2, dy: 75)) let text = Text( text: "Show", font: Font(name: "Serif", size: 21), fill: Color.white, align: .mid, baseline: .mid, place: .move(dx: 375 / 2, dy: 75)) let group = Group(contents: [shape, text]) super.init(node: group, coder: aDecoder) } } 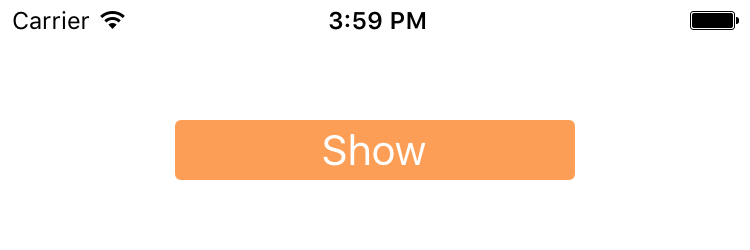
Note that we define each element in the group so that the center of the element coincides with the origin (0, 0), and then we transfer this point to the center of the screen using .move(dx: 375 / 2, dy: 75) . However, we do not need to do this for each element, because now we can move the group itself:
class MyView: MacawView { required init?(coder aDecoder: NSCoder) { let shape = Shape( form: Rect(x: -100, y: -15, w: 200, h: 30).round(r: 5), fill: Color(val: 0xff9e4f)) let text = Text( text: "Show", font: Font(name: "Serif", size: 21), fill: Color.white, align: .mid, baseline: .mid) let group = Group(contents: [shape, text], place: .move(dx: 375 / 2, dy: 75)) super.init(node: group, coder: aDecoder) } } Image
The last element in our arsenal is the image. It has the following properties:
src- path to the filew/h- the actual height / width of the picturexAlign/yAlign/aspectRatio- properties for centering the image
Let's add an image to our scene:
let image = Image(src: "charts.png", w: 30, place: .move(dx: -55, dy: -15)) let group = Group(contents: [shape, text, image], place: .move(dx: 375 / 2, dy: 75)) 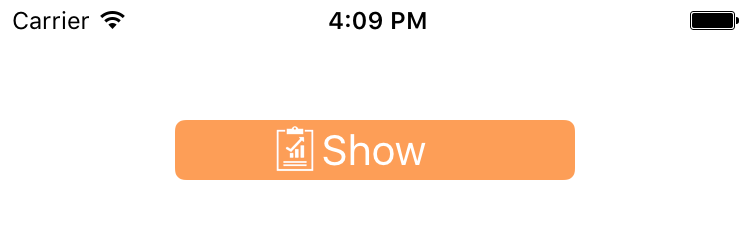
By default, the height and width are taken from the dimensions of the original image. If only one property is defined, then the second will be calculated automatically according to the proportions of the image.
Colors and gradients
In the examples above, we have already used several options for specifying color:
let color1 = Color.blue let color2 = Color(val: 0xfcc07c) Other useful methods can be found in the Color class:
let color3 = Color.rgb(r: 123, g: 17, b: 199) let color4 = Color.rgba(r: 46, g: 142, b: 17, a: 0.2) Macaw also supports linear and radial gradients that can be used to set the fill / stroke properties of scene elements. Each gradient is defined by a set of colors with offsets. Gradient Example:
let fill = LinearGradient( // (x1, y1) (x2, y2) // x1: 0, y1: 0, x2: 0, y2: 1, // userSpace true, // , , // (0,0) - // (1,1) - userSpace: false, stops: [ // 0 () 1 () Stop(offset: 0, color: Color(val: 0xfcc07c)), Stop(offset: 1, color: Color(val: 0xfc7600))]) It may seem that such a definition of a gradient looks cumbersome, but for simple gradients you can use more simple constructors. In particular, our example can be rewritten as follows:
let fill = LinearGradient(degree: 90, from: Color(val: 0xfcc07c), to: Color(val: 0xfc7600)) Counting all angles in Macaw goes clockwise and starts at 3 o'clock. Therefore, 90 degrees is exactly the direction from top to bottom.

Now let's fill our button with a gradient instead of the usual color:
let shape = Shape( form: Rect(x: -100, y: -15, w: 200, h: 30).round(r: 5), fill: LinearGradient(degree: 90, from: Color(val: 0xfcc07c), to: Color(val: 0xfc7600)), stroke: Stroke(fill: Color(val: 0xff9e4f), width: 1)) 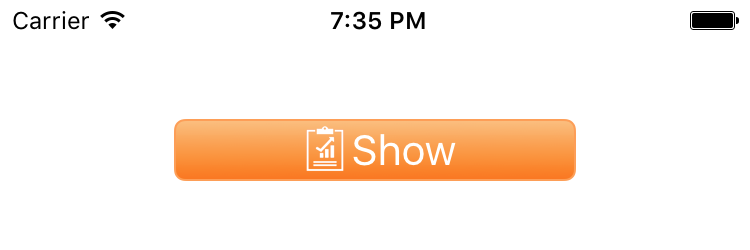
Developments
Events allow the user to interact with the scene. Macaw can handle events such as tap , rotate and pan . Add the following line at the end of the init method:
_ = shape.onTap.subscribe(onNext: { event in text.fill = Color.maroon }) Now, as soon as the user clicks on the button, it will change color to dark burgundy.
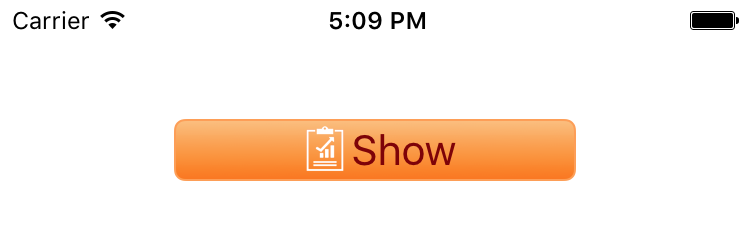
For Macaw events, the RxSwift library is very powerful. In particular, each subscribe method returns a special protocol Disposable , which allows you to conveniently manage all registered listeners. Since in this case we want to handle the event for the entire lifetime of the figure, we simply use _ = to show it.
If you run our example, you will notice that a click in the middle of the button does not work. This is due to the fact that clicking on the button shape intercepts the text. This can be easily repaired by adding the same handler for the button text and its picture. However, a better solution would be to indicate that these elements cannot receive events. This can be easily done using the opaque property:
let text = Text( text: "Show", font: Font(name: "Serif", size: 21), fill: Color.white, align: .mid, baseline: .mid, place: .move(dx: 15, dy: 0), opaque: false) let image = Image(src: "charts.png", w: 30, place: .move(dx: -40, dy: -15), opaque: false) Transformation
As we have seen, the place property can be used to position any element on the scene. In fact, this property is a matrix of affine transformations that allows you to transfer points from one coordinate system to another. In fact, the Transform class in Macaw provides an interface that is very similar to the CGAffineTransform from Core Graphics, so we will not dwell on it in detail. For a general presentation, the following animation will suffice:

Charts
Macaw does not have direct support for graphs and charts, because they are extremely easy to do without additional libraries. First, we put a little order in the changes that have been making all this time. This is what we ended up with:
class MyView: MacawView { required init?(coder aDecoder: NSCoder) { let button = MyView.createButton() super.init(node: Group(contents: [button]), coder: aDecoder) } private static func createButton() -> Group { let shape = Shape( form: Rect(x: -100, y: -15, w: 200, h: 30).round(r: 5), fill: LinearGradient(degree: 90, from: Color(val: 0xfcc07c), to: Color(val: 0xfc7600)), stroke: Stroke(fill: Color(val: 0xff9e4f), width: 1)) let text = Text( text: "Show", font: Font(name: "Serif", size: 21), fill: Color.white, align: .mid, baseline: .mid, place: .move(dx: 15, dy: 0), opaque: false) let image = Image(src: "charts.png", w: 30, place: .move(dx: -40, dy: -15), opaque: false) return Group(contents: [shape, text, image], place: .move(dx: 375 / 2, dy: 75)) } } Now add the coordinate axes just below our button:
required init?(coder aDecoder: NSCoder) { let button = MyView.createButton() let chart = MyView.createChart(button.contents[0]) super.init(node: Group(contents: [button, chart]), coder: aDecoder) } private static func createChart(_ button: Node) -> Group { var items: [Node] = [] for i in 1...6 { let y = 200 - Double(i) * 30.0 items.append(Line(x1: -5, y1: y, x2: 275, y2: y).stroke(fill: Color(val: 0xF0F0F0))) items.append(Text(text: "\(i*30)", align: .max, baseline: .mid, place: .move(dx: -10, dy: y))) } items.append(createBars(button)) items.append(Line(x1: 0, y1: 200, x2: 275, y2: 200).stroke()) items.append(Line(x1: 0, y1: 0, x2: 0, y2: 200).stroke()) return Group(contents: items, place: .move(dx: 50, dy: 200)) } private static func createBars(_ button: Node) -> Group { // return Group() } 
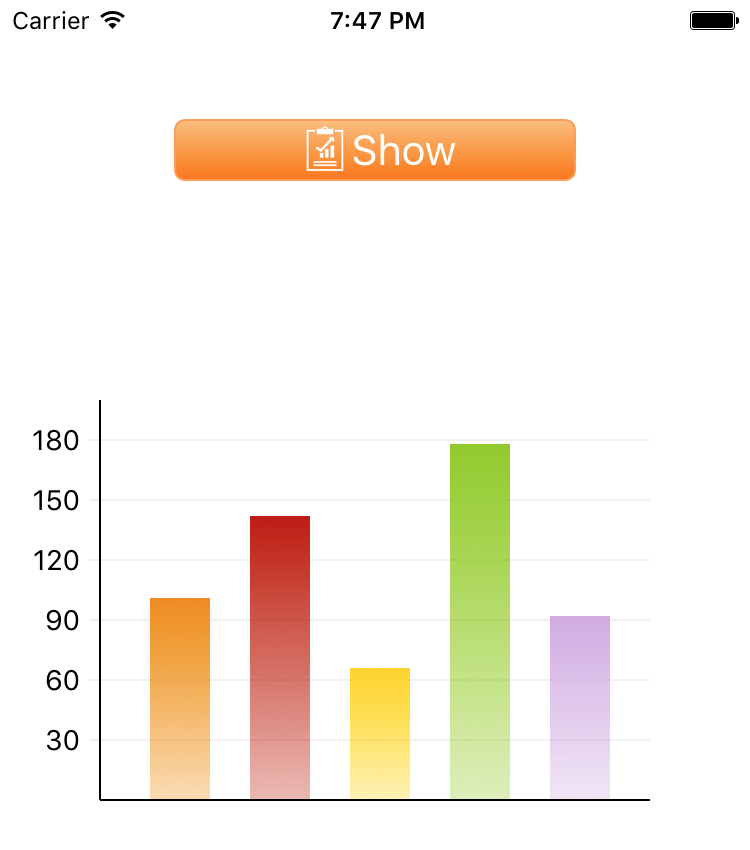
And now it's time to add the histogram itself:
static let data: [Double] = [101, 142, 66, 178, 92] static let palette = [0xf08c00, 0xbf1a04, 0xffd505, 0x8fcc16, 0xd1aae3].map { val in Color(val: val)} private static func createBars(_ button: Node) -> Group { var items: [Node] = [] for (i, item) in data.enumerated() { let bar = Shape( form: Rect(x: Double(i) * 50 + 25, y: 0, w: 30, h: item), fill: LinearGradient(degree: 90, from: palette[i], to: palette[i].with(a: 0.3)), place: .move(dx: 0, dy: -data[i])) items.append(bar) } return Group(contents: items, place: .move(dx: 0, dy: 200)) } In fact, in the createBars method createBars we turned the source data into a beautiful histogram, and for this we needed less than 10 lines of clear, declarative code! Now is the time to set this chart in motion.
Animation
From a Macaw point of view, animation is the process of changing the properties of a scene over time. If you look closely at the interfaces of the scene elements, you will notice that in addition to properties such as opacity or place , there are also properties opacityVar and placeVar . These properties can just be used for animation. For example, to animate the opacity property, we will use the opacityVar property. The easiest way to start an animation is to call the animate function:
node.opacityVar.animate(to: 0) In this case, the animation will start immediately and the node element will gradually disappear within one second until it disappears altogether.
You can imagine any animation as a set of three parts:
- Animated property
- Animation time By default it is always one second.
- And a function that generates values for each animation step.
Macaw allows you to define this function yourself, however, it is usually easier to define it using three values:
fromis the initial value that will be set before the animation begins. If not set, then the current value of the property will be used.to- final valueeasing- a function that determines the rate of change of values depending on time
Now let's add animation to our diagram. First, add all histogram elements opacity: 0 to hide them and run our animation by clicking on the button:
_ = button.onTap.subscribe(onNext: { _ in bar.opacityVar.animate(to: 1.0) }) Result in action:
Just one line we set our application in motion! Let's now try a different effect: instead of a gradual appearance, our columns will grow from the coordinate axis X. To do this, we can change the scale of the elements from zero to the original value.
let bar = Shape( form: Rect(x: Double(i) * 50 + 25, y: 0, w: 30, h: item), fill: LinearGradient(degree: 90, from: palette[i], to: palette[i].with(a: 0.3)), // y 0 place: .scale(sx: 1, sy: 0)) items.append(bar) _ = button.onTap.subscribe(onNext: { _ in // bar.placeVar.animate(to: .move(dx: 0, dy: -data[i])) }) In addition, we can show different columns with different delay. For this we will use the delay parameter:
bar.placeVar.animate(to: .move(dx: 0, dy: -data[i]), delay: Double(i) * 0.1) Voila! Now, when clicking on the Show button, we see the desired:
Svg
As we mentioned earlier, Macaw has built-in support for SVG. You can use the SVGParser.parse method to read the SVG file as an element of the scene that can be combined with other elements, or you can send it directly to MacawView.
class SVGTigerView: MacawView { required init?(coder aDecoder: NSCoder) { super.init(node: SVGParser.parse(path: "tiger"), coder: aDecoder) } } 
Having mastered the basic concepts of Macaw, you can create even more interesting examples. For example, in a few hours we managed to get the following:

')
More information about the project can be found on our github page. We are actively working on documentation and new examples, wait for updates!
Source: https://habr.com/ru/post/313630/
All Articles