Seasons change each other earlier from year to year in Kemerovo
Shuddering once again, I completely fastened my jacket and quickened my pace, hurrying to work. At work, hot coffee, a warm system unit and interesting tasks. But they weren't spinning in my head while a cold wind fumbled in my bosom, but a slight vague suspicion about the change of seasons. It was necessary to check whether warming and cooling are really coming on time, and not earlier? Maybe the seasons are shifted?
It goes without saying that when I arrived at work I forgot to think about my vague suspicion. But it did not dissipate completely, but periodically emerged in my head when, for example, I suffered from heat in May or saw a yellowing tree in July.

So, not really following the principle that you need to start making an idea in the first 48 hours, after many months I did a little research to check my suspicion. Reminder was an article on Gismeteo .
Data
The first step was to get the data. As it turned out, to find the average daily temperature is not so easy as it may seem. After five minutes of googling, I came across a question on the Toaster , from where I got to the site www.ncdc.noaa.gov . But the data I was not satisfied (a lot of omissions in the dates), continued google received the required on the site http://aisori-m.meteo.ru/waisori/ .
A piece of data:
29645 1955 1 1 "-31.0" 29645 1955 1 2 "-23.8" 29645 1955 1 3 "-18.7" 29645 1955 1 4 "-13.3" 29645 1955 1 5 "-16.8" 29645 1955 1 6 "-16.8" 29645 1955 1 7 "-18.6" 29645 1955 1 8 "-17.0" 29645 1955 1 9 "-6.7" 29645 1955 1 10 "-10.4" Getting annual temperatures with offset
First of all, I converted csv with data into an array of objects.
Then I wrote a function that returned a year from the array with an offset of a few days.
In more detail, we have such a piece of array:
... 1955 12 29 -34.5 1955 12 30 -37.7 1955 12 31 -36.3 1956 1 1 -29.2 1956 1 2 -32.9 1956 1 3 -38.1 1956 1 4 -36.6 ... If the function requests all the data of 1956, then they simply returned, and if you request data with an offset of -1 day, then the temperature for each day will be taken from the previous day. That is, for January 1, 1956, the temperature will be taken on December 31, 1955
... 1956 1 1 -36.3 ← ( 1955 12 31) 1956 1 2 -29.2 ← ( 1956 1 1) 1956 1 3 -32.9 ← ( 1956 1 2) 1956 1 4 -38.1 ← ( 1956 1 3) ... Getting average monthly temperature
In the resulting array slice for the year, I calculated the average monthly temperatures, thereby obtaining the temperature vector for the year.
[ -16.716129032258067, -16.317857142857143, -17.690322580645155, -11.57333333333333, 0.3967741935483872, 9.163333333333332, 17.845161290322586, 17.225806451612904, 15.490000000000004, 9.922580645161291, 1.7233333333333334, -8.26774193548387 ] Distance between offset years
If I have a temperature vector for a year, then I can compare the distance between the vectors.
That is, if the weather in general almost did not change from year to year, the distance between the vectors would be zero. From here I decided that I would compare, for example, the vector of 2001 and all the vectors of 2002 obtained by offset.
... 2001 == 2002 -2 2001 == 2002 -1 2001 == 2002 2001 == 2002 +1 2001 == 2002 +2 ... After taking the offset of that comparison, where the distance between the vectors is minimal. That is, if it turns out that the distance between 2001 and 2002 +2 minimum, it means that the 2002 season was shifted 2 days ahead relative to 2001.
Looking ahead to say that I took for the initial year of 1956 and looked at the offset for 30 days ahead and back.
We make out the code
I programmed the algorithm on js and made a small website for easy verification.
Source code on githaba .
Checking assumptions
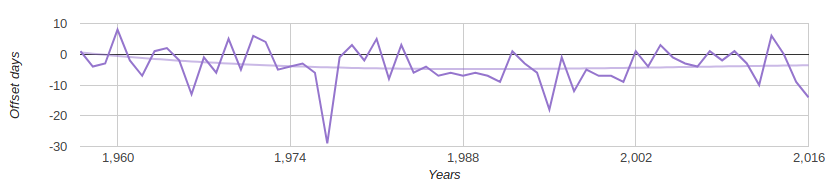
Kemerovo
Aha Seasons began to change faster from 2013 for 10 days, and on average from 1956 to 8 days!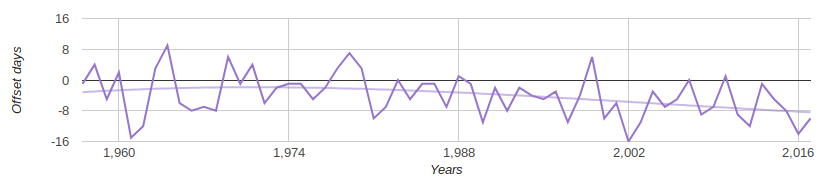
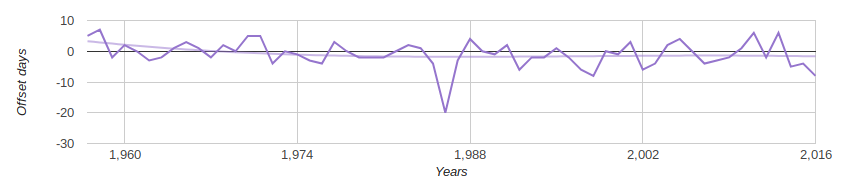
Moscow
There is almost no bias.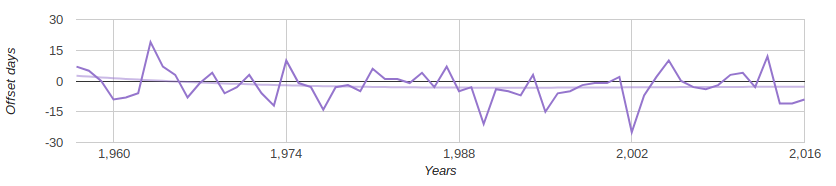
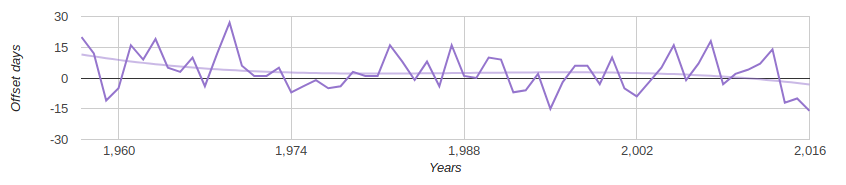
Arkhangelsk
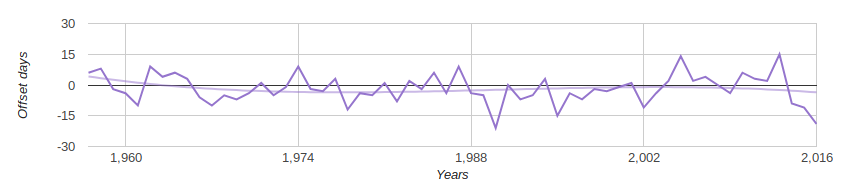
Kaliningrad
St. Petersburg
Tyumen
Vladivostok
Conclusion
The sensation was not deceived, but the sensations still need to be checked.
PS In fact, I was looking for Novosibirsk. The site of Novosibirsk was not there, but Kemerovo was completely satisfied with me.
PPS As it turned out a little later, the 2018 file was missing in the file, and I needed January of this year, so I downloaded the missing month from the site pogodaiklimat.ru .
')
Source: https://habr.com/ru/post/421077/
All Articles