NVIDIA Launches Parallel CPU and GPU Computing Product

NVIDIA launches a new commercial product - NVIDIA Parallel Nsight , which is a suite of tools that integrate into Visual Studio 2008 SP1 . NVIDIA Parallel Nsight offers tools for developing parallel applications that use multi-core processors and modern GPU accelerators at full capacity.


')


New product features include:
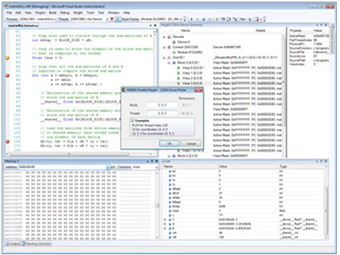
- powerful debugger with the ability to view thousands of threads running in parallel;
- debugging code directly on the GPU;
- viewing GPU memory directly in Visual Studio;
- memory leak detection using the CUDA C / C ++ Memory Checker tool;
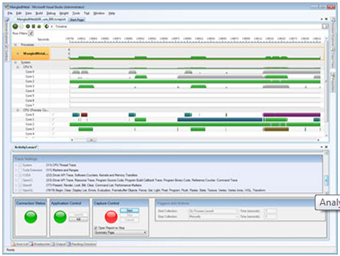
- code execution time analyzer with capture of API calls, kernel launch, memory exchange;
- detailed visualization of all events in the Visual Studio window;
- filtering and sorting events using report building tools;
- CUDA profiling with GPU performance counters
- graphics tools and debugger with HLSL shader debugging directly on the GPU;
- debug any graphic or shader application;
- graphical inspector with real-time call detection;
- interactive check of the state of the GPU pipelines, visualization of textures, geometry and computational buffers;
- profiler, which will determine the bottlenecks and consumption of CPU resources.
NVIDIA Parallel Nsight will be supplied in two versions: Standard and Professional (contains analyzer). So far, at the time of the release of the preliminary version, Parallel Nsight 1.0 Professional is available for download .
Product licensing information can be found on this page . Please note: academic program participants will be able to license the tool for free.
It is expected that over time the tools will receive an update and support for Visual Studio 2010 .
Source: https://habr.com/ru/post/99739/
All Articles