Old maps for new

About 4 months ago we decided to update the maps a little. It seems to be like, one of the sections to which we strongly draw the attention of users.
It happened 4 months ago, but only today we, Eugene johnny_palec Emelyanov and Anton kashey Korzunov would like to tell the story of the creation of the service “On the map” of the portal gdeetotdom.ru . In some ways, we were pioneers, in something catching up, but in any case, a lot of rakes were collected, and ultimately we got a unique service of its kind (is it not too noticeable that we are proud of it?).
We would like to share our research, mistakes and findings with the community of habr-web developers. But first things first.
We are ours, we will build a new world
On our portal for a long time there is a huge amount of visual content - photos of houses, panoramic photos of courtyards, spherical shooting of cities. In addition, we have detailed information on buildings, planning, infrastructure areas. But this content was spread throughout the portal and often carried an entertaining character rather than being an auxiliary tool for finding real estate. Our task was not only to combine information and visual content, but also to make a new service an independent tool for searching, analyzing and selecting real estate.
')
Interfaces and Usability
We decided to combine the riches on the map in the form of layers and create a receiver of our then-existing service “Where This House”, in which the photos of houses, infrastructure and spherical panoramas were displayed on the map. In addition, it was necessary to add and in the context of what should be the visual content - real estate ads from our database. Interface surveys are easier to illustrate with prototypes of two prototypes — the classic approach with baluns and the option when information on an object is shown in a separate block. We finally settled on the classical approach, although we had to solve the problem with placing a large amount of information in a small balun - as decided, you can see in the working version.
If, having read it, you (once again) thought that it’s worth visiting us only to buy or sell your habitat, we can disappoint you - a new service on the map will be able to help you both find a new cafe near the house and plan ( and hold) the next meeting of bikers ( Night Wolves ).
Google + Yandex = mutually beneficial cooperation
In fact, mutually beneficial operation :) Objects need to be shown throughout Russia, and the coverage and quality of maps from Google and Yandex are different, so we decided to use both APIs, showing by default those maps that are better suited for this region with the possibility of manual change. Also, if for one reason or another, the API of the selected card by default does not load the user - the second option is automatically loaded.
True, we do not fully understand why this is required, but the fact remains that one part of people has google.com blocked, and for some reason Yandex is working for some reason.
Switching to the working version of the cards occurs automatically, based on the basic principles of our IPA, which we will discuss below.
Cultivation of cartographic layers in central Russia
The initial task was simple - the cards should work, and the cards should work well. And preferably everywhere.
Development began in mid-November, a couple of days after Google Day.
Therefore, our cards:
1. Google maps v3
2. Yandex maps of the latest versions
3. The most good and almost the most intelligent.
The initial version of the maps was ready in two weeks.
We actually invested in them everything that we knew before and everything that we thought up along the way, and let's forget that we are in fact a serious site about real estate and will only chat about the technical side of the issue.
Five steps somewhere
We set a goal - to create a tool on the basis of the map and try to implement it.
Step 1 - to start the card you need to run
Step 2 - then you need to somehow set its initial parameters
Step 3 - you probably need to request some data from the server
Step 4 - somehow display them
Step 5 - and finally do something with them
and now, a little more detail
You should also indicate in advance that 90% of function calls, intermodular messages, and the like are triggered by setTimeout. Saves from errorov and podvisonov. If you need details - ask.
PS: also, due to wrapping calls into such timeouts (in our understanding _enterState \ _leaveState \ _callState) we always know what started where, how long it took, and we can catch errors (but we can't catch callStack), we also catch Error on window.onerror and constantly collect and analyze these erlogs. This helps YOU greatly to work on our site without errors.
Step 1 - Download API
To begin, I will put you before the fact - you cannot communicate directly with the API. At all. Never.
Yes, and it is not convenient, to be honest.
So let's create some object with which we will communicate.
Let's call it SuperMaps.
We define, for starters, three methods - SetWorker, StartWorker, KillWorker ( skip the moment that you should actually call SetMapProvider or other clever words that reflect the purpose of the component. It’s actually one task - WORKING! )
The first one sets the version of the card we use, the second one starts it, and the third one, as it happens, kills.
However, it should be clarified that the “variant of the card” here means again the wrapper of the final API, and not direct use (do not be alarmed; personally, such wrappers do not exceed 200 lines)
For a successful launch, use the following sequence of actions:
1. start timer start
2. connecting the API (defered), in the case of google maps here we have two steps - at the beginning we try to download api from google.com, if that does not work out - from google.com. And this is not a whim (error logs see everything).
3. Check the connection API
4. launch of the API
5. launch report
5+. launch of other systems
(6) somewhere here timer 1 is triggered, if there is no card, we will have to try another API. Oddly enough - this happens quite often - firewalls, plug-ins and crap channels work wonders.
Step 2 - Poke your nose at the desired point on the map
At this stage, you need to open the map at a certain point. There is nothing really outstanding here - the parameters of the current viewport are stored in the url, from where they are taken. If they are not there, the “featured” address is opened, or, if you have already visited the site - the data of your last session, from the cookies, for each domain-region of our site separately. Here is a feature. Very comfortably :)
Step 3 - Retrieve data from server
Relatively recently, I already talked about data loading secrets in the form of a heap of tiles , though in the implementation where this year's tiles are not loaded in a heap - up to 6 pieces are transmitted from a server in one request. More precisely, the system tries to always load data into 4 streams, but no more than N tiles in one pack.
Tile addressing in this case looks like / maptiles / 7-l032 / 103/031/311/011; 21 ~ 2; 20 ~ 21; 19 ~ 100; the most big-eyed may notice that 4 tiles of the seventh layer are requested here, which have a slightly different tail. For the client, such optimization is equivalent to reducing the time of the peg, and saving traffic, since the more fat the file is, the more gigantic it gets. And of course, we should not forget that the “client caching” of our data does not make sense - 90% of the data changes in a day. And it is not difficult for the server to assemble already prepared files in a pack - it is iron.
However, one ridiculous case is connected with this algorithm - initially, for better optimization, we took an array of addresses, performed natsort and split it into beautiful URLs.
Strangely enough, this option, which worked perfectly in all browsers, tightly hung any IE, if there were more than 40 blocks in the first array (full screen for one layer creates requests for 6-8 blocks of data, the client can activate 50 layers of data ).
At the moment, we use the usual sort, which does not produce the most ideal option, and sometimes the url becomes long.
In our case, this subsystem of loading, storing and, at the same time, display control is central and is called ZTile .
Step 4 - somehow display them, this data
With the display we have connected, probably, one of the main architectural problems.
So, a certain set of objects came from the server, each object has its own base type (advertisement, POI, photo, etc.) and its own layer (in fact, the sequence number of the predefined where-expression from the base).
How on the basis of this data to display information.
We have a pipeline with something like this:
zTile-Server-data-zTile-SuperMaps-type factory-type-factory of layers- * sorting, clustering * -SuperMaps-APIworker-API-view-type-render
The chain is long, and let me explain it.
zTile requests data from the server, after which it receives it.
Then he asks for the main component - SuperMaps - to create a model for the object.
SuperMaps looks at the declared handlers, and if one of them agrees to accept the object, delegates the creation of an object of this type to it.
The received object is filled with the indexer of the layer in which the object was loaded, after which, after the factory burns through the layers, the object can change its type (more precisely, specify its behavior).
After this, the object basically knows what it is and how it would like to be displayed.
* sorting * will be described in step 5, but, in essence, it will simply tell the objects that while they are out of the shadow, and leave an entry about themselves in the DOM tree.
When displaying an object, it sends itself to the render again in SuperMaps, which drops the call to the current worker, who creates a view of the maker (control, balun), after which this view will be activated to the model of the displayed object.
After that, as luck would have it, he can again change his presentation to adapt to the needs of the API.
This does not happen on Yandex or Google maps, but on the same Ovi - where you just can't draw your html into a marker - the system will work that way.
One of the benefits of this approach is that the final API of maps is essentially finite in any sense.
We can change it and display the same set of objects, in the same form, but on a different map, simply by changing the map and calling refresh clustering.
Step 5 - normally display the data, and other buns
One of the most difficult issues when displaying a dataset, especially a large dataset, and especially a dynamically changing dataset is heaps of markers that crawl onto each other.
Our clustering option (IMHO) is the best known to me, and surpasses the same googlemarkermanager (v2 \ v3) both in terms of functionality and speed.
And it works very simple.
By the same principles as loading data in step 3, we split the card into clear cells, and attack objects that fall into them into these cells.
After that, within the set of objects of a single cell, mutual overlap is determined and a banal union occurs.
Only here one thing is positive - no group rebuilding is required without changing the set. The data for overlaying markers for each other in one cell is completely static and only the change of the cell can change this set.
That is, if you move the map and see some new objects - only new groups-cells will be rebuilt. Old, I repeat, are static.
A complete restructuring occurs only when zooming and turning on / off layers, if at least one new object appeared or disappeared from the set of objects in the cluster cluster.
 True, they rightly noticed in the next topic that as a result of such a “square-nested” clustering method various artifacts can appear - after all, the groups work autonomously, and nothing prevents them from leaving seemingly consolidated markers on the borders.
The solution is simple: we create another clusterManager with a slightly different cluster size (one pixel more is enough) and a grid shifted by half its size.
It gets the result of grouping the original markers and this result is again grouped.
He will collapse the overlapping baluns in one. And again, it will not require complete restructuring during card operations.
The truth is to admit that since then, when I wrote these lines, almost half a year has passed, and personally we have not taken advantage of our own advice. not a single card ....
As a result, the system works quite clearly on tens of thousands of markers, and, I think, if you make some more tweaking, you can speed things up another time and a half.
But this is not required, since we already rest on two points - 1. The speed of updating the DOM tree
2. The number of markers on the map.
We solved the first for a long time, looked at various DOM fragments and read kilometer docks, but in the end we decided to just - all appearances and disappearances - there is a group operation, we just wrap it in a transaction (display: none and some more, attachments / parts a little and again we show the map), which reduces reflow & repaint at times. I would very much like to know what was being told about this case (on the subject) at DevConf (but where it wasn’t, it wasn’t).
It should immediately clarify that, since this operation is performed by continuous js code - you will not see any “flashing” of the map.
Secondly, to be honest, we have not decided.
If we have a limit of objects for display, which may change, depending on the speed of the iron friend, we have a marker collapse radius that allows you to clean the map from overload with markers.
But if at the output we overload the amount of markers, and we cannot guarantee the normal operation (IE6) with such a number of objects - they must be reduced. Change one factor and make yourself refresh. As a result, there may be too few objects - once again we change one of the factors and refresh.
As a result, the algorithm sometimes converges to 8 “ticks”. True, the user is almost invisible.
Is this the end?
This story is probably yes, the end. It makes no sense to increase the size of the topic. We will describe the most interesting moments in a little more detail later with separate, more detailed materials.
Various subtleties, such as installing the necessary callbacks in the right places, resizing the card with a slider, “external baluns” (probably, still look at our implementation of such a simple thing as a balun marker), debugging and logging ...
Let's better we just answer your questions, but we'll see.
What's next?
At the moment we have already released the third version of the service “on the map”, and in the near future we plan to expand both the displayed content and the interface approach. The map will display news and analytical content, the player will turn into something like an independent search tool - the houses will display real estate offers, information on the house itself, you can look into the courtyards and inside the buildings themselves and much more. But it will be a completely different story. Thanks for attention. Ready to answer questions in the comments.
So what is interesting and why it was necessary or will need to read the kilometer of the text above and look at the site itself :
1.two API (actually 4 (+ ovi, + bing) without switching problems
2. upload data from server, reloaded
3. External baluns on the map - but they are better to watch (open the balun and move the map)
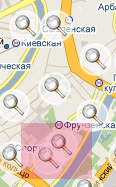
4. clustering of markers and data in the balun ( www.gdeetotdom.ru/map/#lat=55.72867&lng=37.81804&m=google&z=15&l=7-14 , exactly in the bottom and in the middle of the map)
5. Google display of Yandex tiles on a Yandex map (Russia 360 tracks of the roads)
Source: https://habr.com/ru/post/98597/
All Articles