Profiling Applications in Visual Studio 2010
Today, we will measure the performance of our application using the Visual Studio Profiling Tool .
Visual Studio Profiling Tool allows developers to measure, evaluate application and code performance. These tools are fully embedded in the IDE to provide the developer with continuous monitoring.
In this guide, we will step by step profile PeopleTrax applications using Sampling and Instrumentation profiling methods to identify problems in application performance.

')
A lot of pictures.
To work with this guide, you will need:
We will slightly deviate from the main topic of the article and consider possible methods of profiling. You can skip this chapter; the profiling methods used will be briefly described before use.
Sampling - collects statistics about the application (during profiling). This method is lightweight and therefore, as a result of its work there is a very small error in the data obtained.
Each specific time interval is collected information about the call stack (call stack). Based on this data, performance is calculated. Used for initial profiling and for identifying problems related to processor usage.
Instrumentation - collects detailed information about the operation time of each function called. Used to measure I / O performance.
The method injects its code into a binary file that captures synchronization information (time) for each function in the file, and for each function that is called in this one.
The report contains 4 values for providing elapsed time:
Concurrency - collects information about multi-threaded applications (how to debug multi-threaded applications, see the "Guide to debugging multi-threaded applications in Visual Studio 2010" ). The method collects detailed information about the call stack, each time when competing threads are forced to wait for access to the resource.
.NET Memory - profiler collects information about the type, size, and the number of objects that were created in the distribution or were destroyed by the garbage collector. Memory profiling hardly affects the performance of the application as a whole.
Tier Interaction - adds information to the file for profiling about ADO.NET synchronous calls between an ASP.NET page or other applications and a SQL server. Data includes the number and time of calls, as well as the maximum and minimum time.
This is where we’ll finish profiling methods and continue to learn how to profile applications.
Sampling is a profiling method that periodically polls the process in question to determine the active function. As a result, it shows the number of times the function was at the beginning of the call stack during testing.
Open the PeopleTrax test project. We set the configuration in Release (additional information is embedded in the Debug version for debugging the application, and it will have a bad effect on the accuracy of the profiling results).
In the Analyze menu, click on the Launch Performance Wizard .
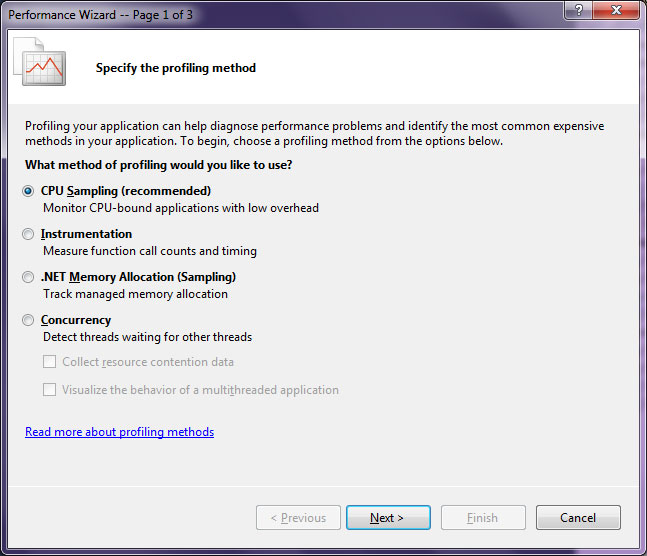
At this step, you need to select a profiling method. Select CPU Sampling (recommended) and click Next.
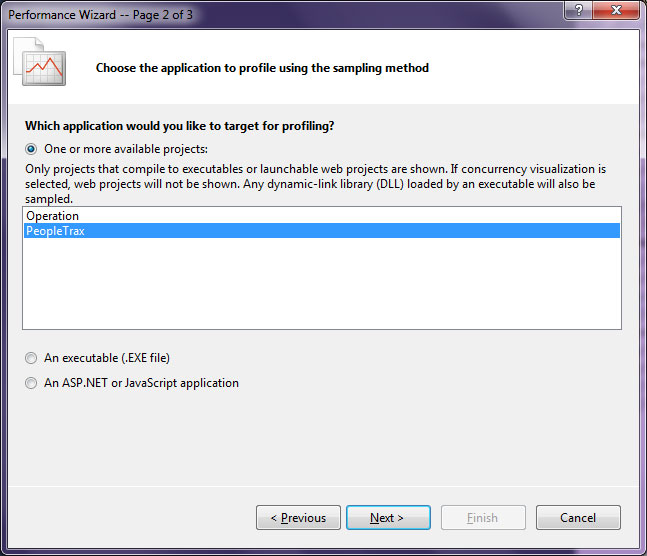
Choose which application we will profile, this is PeopleTrax and the Next button. Next, click Finish and the profiler and our application will automatically start. On the screen we see the PeopleTrax program. Click the Get People button, wait for the completion of work and Export Data . Close the notebook and the program and the profiler will generate a report.

Profiler generated report (* .vsp)
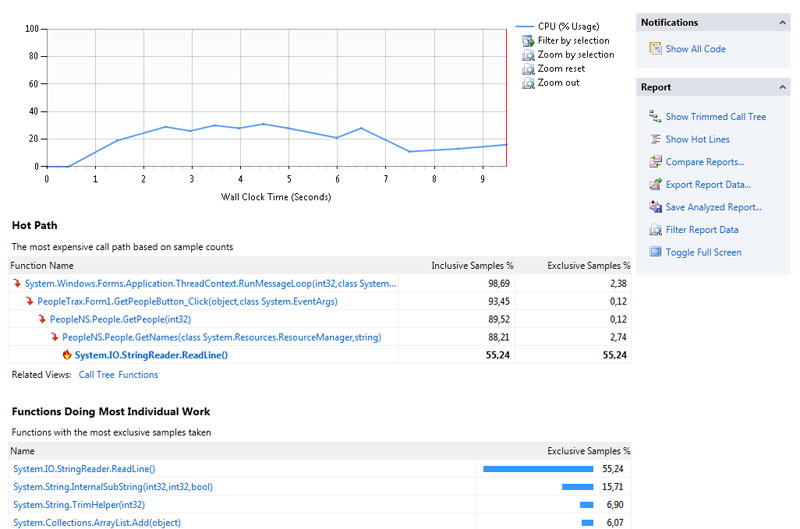
The Summary displays a graph of processor usage over the entire profiling time. The Hot Path list shows the call branches that are most active. And in the list of Functions, Doing Most Individual Work (whose name speaks for itself) are functions that took up more time in the body of these functions.
Looking at the Hot Path list, we see that the PeopleNS.People.GetNames method occupies almost the last place in the call branch. You can examine it more carefully for performance improvements. Click on PeopleNS.People.GetNames and Function Details will open before us.
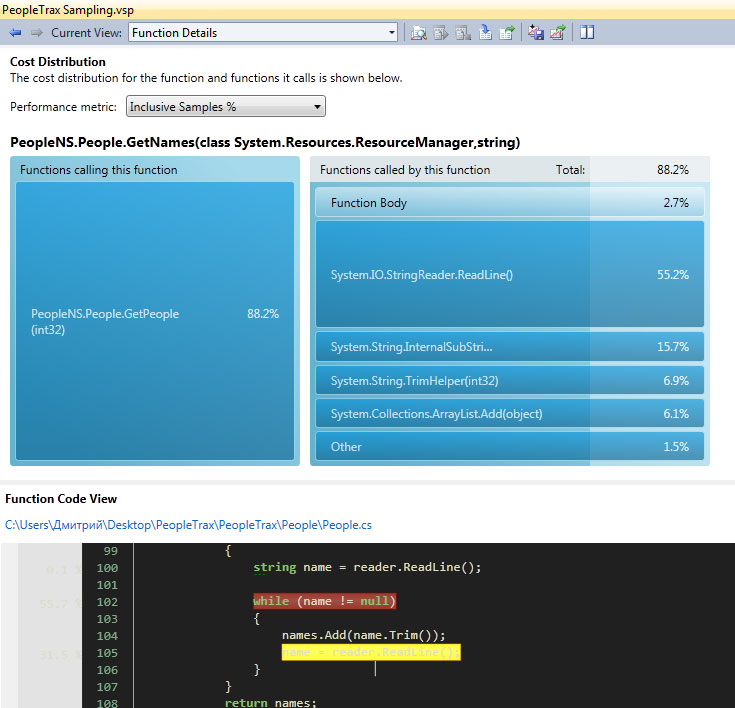
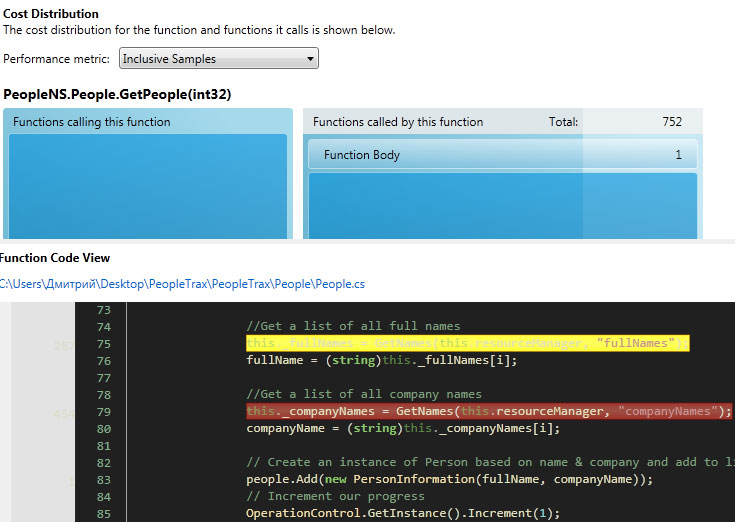
This window contains two parts. The expenditure window provides a graphical representation of the functions that work, and the contribution of the function and its callers to the number of instances that were selected. You can change the function in question by clicking on it with the mouse.
The Function Code View shows the method code when it is available and highlights the most “expensive” lines in the selected method. When the GetNames method is selected, you can see that it reads strings from application resources using a StringReader , adding each string to an ArrayList . There are no obvious ways to improve this part.
Since PeopleNS.People.GetPeople is the only one who calls GetNames , we’ll click GetPeople . This method returns an ArrayList of PersonInformationNS.PersonInformation objects with the names of people and companies returned by the GetNames method. However, GetNames is called twice each time a PersonInformation is created. (This is shown in yellow and red). Obviously, you can easily optimize the method by creating lists only once at the beginning of the method.
An alternative version of GetPeople is also in the code and we will enable it now. To do this, you need to define OPTIMIZED_GETPEOPLE as a Conditional compilation symbol in the properties window of the People and PeopleTrax project . And yes, if you want to repeat my experiments, then you need to correct the error in the project. In the optimized class constructor, the name of resources is not correctly written: you need PeopleNS.Resources together PeopleNS.Resource. If this does not change, everything falls with terrible mistakes.
The optimized method will replace the old one with the next build.
Restart profiling in the current session by clicking Launch with Profiling in the Performance Explorer window. Click on Get People and Export Data . Close the notebook and the program and the profiler will generate a new report.
To compare two reports, we select both and the Compare Performance Reports reports. The delta column shows the performance difference of the Baseline version with the later Comparison . Select Inclusive Samples% and Apply.
As you can see the performance gain is noticeable to the naked eye.
This method is useful for profiling I / O operations, writing to disk, and exchanging data over a network. This method provides more information than the previous one, but it carries with it more overhead. Binaries received after inserting additional code are more common, and are not intended for deployment.
This time we will focus our analysis on the export of data, in which the list of people is recorded in the notepad file.
In Performance Explorer, select Instrumentation and click Start Profiling. Click Get People. After loading people, wait 10 seconds and click Export Data. Close the notebook and the program. The profiler will generate a report.
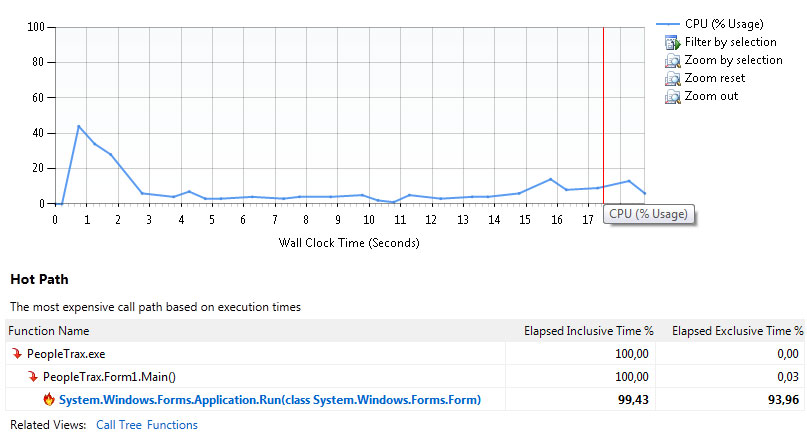
The profiler will show this picture:
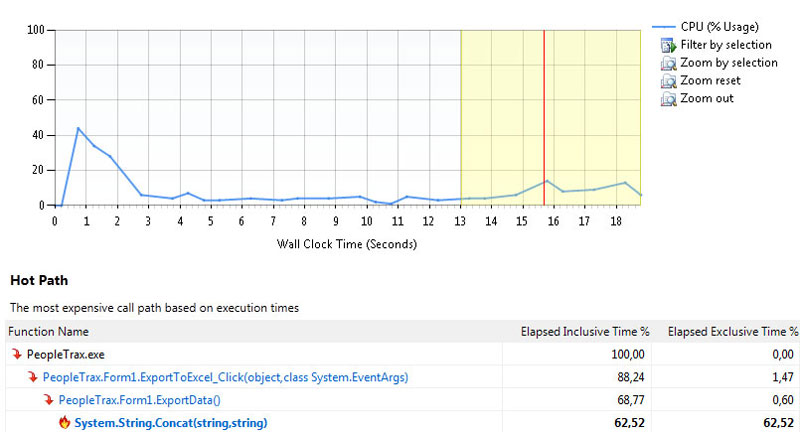
We did not get the information we wanted. Filter the data. We deliberately waited 10 seconds to simply filter out the profiling data that is no longer needed. Mark from the 13th to the end and click Filter by selection . Already another result:
Hot Path shows that the Concat method takes a lot of time (it is also the first in the list of Functions With Most Individual Work). Click on Concat to view detailed information about the method.

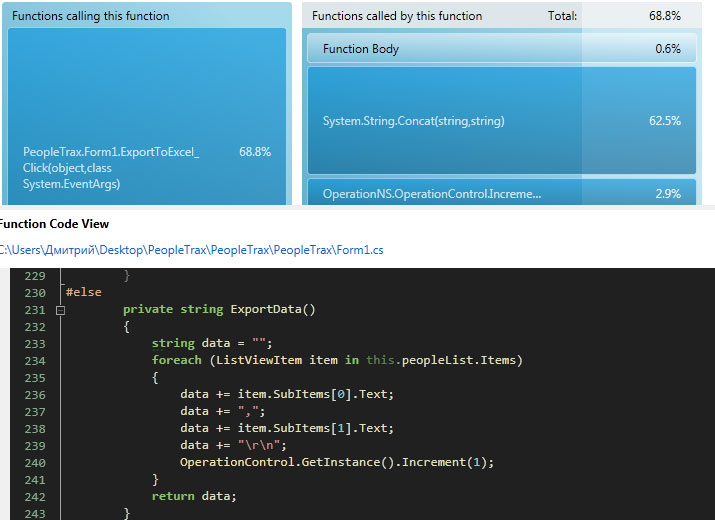
You can see that PeopleTrax.Form1.ExportData is the only method that calls Concat . Click PeopleTrax.Form1.ExportData in the calling methods ( Function calling this function ).
Analyze the method in the code window. Please note that there is no direct call to Concat. Together this is the use of the operand + = , which the compiler replaces with the methods System.String.Concat . As almost everyone knows, any changes in rows in .NET lead to the destruction of the old version of the string and the creation of a modified string. Fortunately, in .NET there is a class StringBuilder which is intended for such work.
The project already has an optimized method using StringBuilder . In the PeopleTrax project, add the OPTIMIZED_EXPORTDATA compilation variable. We save and run the profiler again and compare the reports. We immediately see (and logically understandable) that we have optimized the Concat calls (from 6000 to 0 times).
After starting the application, there is a noticeable improvement in performance by eye. It is very important to run the profiling again, there are even visible improvements. Viewing new data after fixing a problem may show other problems in application performance.
Thanks for attention. Quick as lightning you code.
Visual Studio Profiling Tool allows developers to measure, evaluate application and code performance. These tools are fully embedded in the IDE to provide the developer with continuous monitoring.
In this guide, we will step by step profile PeopleTrax applications using Sampling and Instrumentation profiling methods to identify problems in application performance.
')
A lot of pictures.
Training
To work with this guide, you will need:
- Microsoft Visual Studio 2010
- Average knowledge of C #
- A copy of the PeopleTrax test application, available for download from MSDN Code Gallery
Profiling methods
We will slightly deviate from the main topic of the article and consider possible methods of profiling. You can skip this chapter; the profiling methods used will be briefly described before use.
Sampling
Sampling - collects statistics about the application (during profiling). This method is lightweight and therefore, as a result of its work there is a very small error in the data obtained.
Each specific time interval is collected information about the call stack (call stack). Based on this data, performance is calculated. Used for initial profiling and for identifying problems related to processor usage.
Instrumentation
Instrumentation - collects detailed information about the operation time of each function called. Used to measure I / O performance.
The method injects its code into a binary file that captures synchronization information (time) for each function in the file, and for each function that is called in this one.
The report contains 4 values for providing elapsed time:
- Elapsed Inclusive - total time spent on the function
- Application Inclusive - the time spent on the function, with the exception of the time of calls to the operating system.
- Elapsed Exclusive is the time spent executing code in the body. The time spent by functions caused by the target function.
- Application Exclusive - the time spent on executing code in the body. Eliminates the time spent making calls to the operating system and the time spent executing functions caused by the target function.
Concurrency
Concurrency - collects information about multi-threaded applications (how to debug multi-threaded applications, see the "Guide to debugging multi-threaded applications in Visual Studio 2010" ). The method collects detailed information about the call stack, each time when competing threads are forced to wait for access to the resource.
.NET Memory
.NET Memory - profiler collects information about the type, size, and the number of objects that were created in the distribution or were destroyed by the garbage collector. Memory profiling hardly affects the performance of the application as a whole.
Tier interaction
Tier Interaction - adds information to the file for profiling about ADO.NET synchronous calls between an ASP.NET page or other applications and a SQL server. Data includes the number and time of calls, as well as the maximum and minimum time.
This is where we’ll finish profiling methods and continue to learn how to profile applications.
Profiling Sampling Method
Sampling is a profiling method that periodically polls the process in question to determine the active function. As a result, it shows the number of times the function was at the beginning of the call stack during testing.
Profiling
Open the PeopleTrax test project. We set the configuration in Release (additional information is embedded in the Debug version for debugging the application, and it will have a bad effect on the accuracy of the profiling results).
In the Analyze menu, click on the Launch Performance Wizard .
At this step, you need to select a profiling method. Select CPU Sampling (recommended) and click Next.
Choose which application we will profile, this is PeopleTrax and the Next button. Next, click Finish and the profiler and our application will automatically start. On the screen we see the PeopleTrax program. Click the Get People button, wait for the completion of work and Export Data . Close the notebook and the program and the profiler will generate a report.
Profiler generated report (* .vsp)
Analysis of the Sampling Method Report
The Summary displays a graph of processor usage over the entire profiling time. The Hot Path list shows the call branches that are most active. And in the list of Functions, Doing Most Individual Work (whose name speaks for itself) are functions that took up more time in the body of these functions.
Looking at the Hot Path list, we see that the PeopleNS.People.GetNames method occupies almost the last place in the call branch. You can examine it more carefully for performance improvements. Click on PeopleNS.People.GetNames and Function Details will open before us.
This window contains two parts. The expenditure window provides a graphical representation of the functions that work, and the contribution of the function and its callers to the number of instances that were selected. You can change the function in question by clicking on it with the mouse.
The Function Code View shows the method code when it is available and highlights the most “expensive” lines in the selected method. When the GetNames method is selected, you can see that it reads strings from application resources using a StringReader , adding each string to an ArrayList . There are no obvious ways to improve this part.
Since PeopleNS.People.GetPeople is the only one who calls GetNames , we’ll click GetPeople . This method returns an ArrayList of PersonInformationNS.PersonInformation objects with the names of people and companies returned by the GetNames method. However, GetNames is called twice each time a PersonInformation is created. (This is shown in yellow and red). Obviously, you can easily optimize the method by creating lists only once at the beginning of the method.
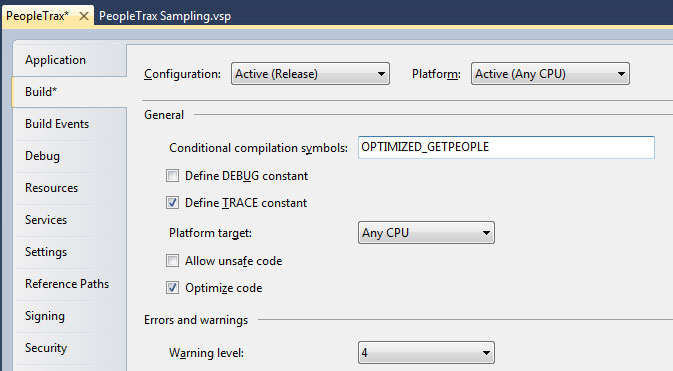
An alternative version of GetPeople is also in the code and we will enable it now. To do this, you need to define OPTIMIZED_GETPEOPLE as a Conditional compilation symbol in the properties window of the People and PeopleTrax project . And yes, if you want to repeat my experiments, then you need to correct the error in the project. In the optimized class constructor, the name of resources is not correctly written: you need PeopleNS.Resources together PeopleNS.Resource. If this does not change, everything falls with terrible mistakes.
The optimized method will replace the old one with the next build.
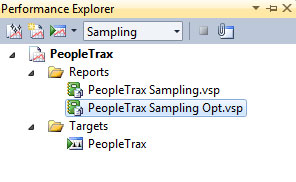
Restart profiling in the current session by clicking Launch with Profiling in the Performance Explorer window. Click on Get People and Export Data . Close the notebook and the program and the profiler will generate a new report.
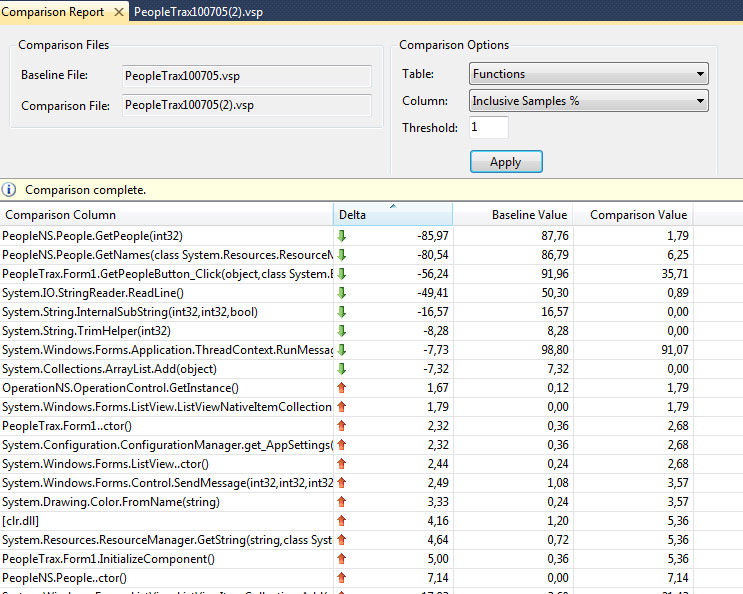
To compare two reports, we select both and the Compare Performance Reports reports. The delta column shows the performance difference of the Baseline version with the later Comparison . Select Inclusive Samples% and Apply.
As you can see the performance gain is noticeable to the naked eye.
Instrumentation Profiling
This method is useful for profiling I / O operations, writing to disk, and exchanging data over a network. This method provides more information than the previous one, but it carries with it more overhead. Binaries received after inserting additional code are more common, and are not intended for deployment.
This time we will focus our analysis on the export of data, in which the list of people is recorded in the notepad file.
Profiling
In Performance Explorer, select Instrumentation and click Start Profiling. Click Get People. After loading people, wait 10 seconds and click Export Data. Close the notebook and the program. The profiler will generate a report.
Analysis
The profiler will show this picture:
We did not get the information we wanted. Filter the data. We deliberately waited 10 seconds to simply filter out the profiling data that is no longer needed. Mark from the 13th to the end and click Filter by selection . Already another result:
Hot Path shows that the Concat method takes a lot of time (it is also the first in the list of Functions With Most Individual Work). Click on Concat to view detailed information about the method.
You can see that PeopleTrax.Form1.ExportData is the only method that calls Concat . Click PeopleTrax.Form1.ExportData in the calling methods ( Function calling this function ).
Analyze the method in the code window. Please note that there is no direct call to Concat. Together this is the use of the operand + = , which the compiler replaces with the methods System.String.Concat . As almost everyone knows, any changes in rows in .NET lead to the destruction of the old version of the string and the creation of a modified string. Fortunately, in .NET there is a class StringBuilder which is intended for such work.
The project already has an optimized method using StringBuilder . In the PeopleTrax project, add the OPTIMIZED_EXPORTDATA compilation variable. We save and run the profiler again and compare the reports. We immediately see (and logically understandable) that we have optimized the Concat calls (from 6000 to 0 times).
After starting the application, there is a noticeable improvement in performance by eye. It is very important to run the profiling again, there are even visible improvements. Viewing new data after fixing a problem may show other problems in application performance.
Literature
- Getting Started with Profiling Tools
- Walkthrough: Profiling Applications
- PeopleTrax Sample (draft)
- Visual Studio Profiler Team Blog
- Guide to debugging multi-threaded applications in Visual Studio 2010
Thanks for attention. Quick as lightning you code.
Source: https://habr.com/ru/post/98361/
All Articles