Guide to debugging multi-threaded applications in Visual Studio 2010
In this article I will discuss how to debug multi-threaded applications in Visual Studio 2010 using the Parallel Tasks and Parallel Stacks windows. These windows will help you understand the execution structure of multi-threaded applications and verify the correctness of the code used by the Task Parallel Library .
We will learn:
Caution, a lot of pictures
For the tests, we need VS 2010. The images in this article were obtained using the Intel Core i3 processor
')
Code for VB and C ++ languages can be found on this page.
Copy the code into the studio in a new project and run in debug mode (F5). The program will compile, run and stop at the first breakpoint.
In the Debug → Windows menu , click on Parallel Stacks. Using this window, we can view several call stacks of parallel threads. The following figure shows the state of the program at the first stop point. The Call Stack window is activated in the same place in the Debug → Windows menu. These windows are available only during debugging. While writing code, they are simply not visible.

In the picture, the 4 threads are grouped together, because their stack frames belong to the same method context, which means that it is the same method (A, B, C). To view the thread ID you need to point at the heading "4 Threads". The current stream will be bold . The yellow arrow indicates the active stack frame in the current thread. To get more information you need to hover the mouse.
To remove unnecessary information or include (for example, the module name, shift, parameter names and their types, etc.), right-click on the table header in the Call Stack window (this is done in the entire Windows environment).
A blue box around it means that the current stream (which is bold) is part of those streams.
We continue the program to the second stopping point (F5). The next slide shows the status of flows in the second point.

In the first step, 4 threads came from methods A , B, and C. This information is still available in the Parallel Stacks window, but now these 4 streams have been developed further. One thread continued in D, then in E. The other in F , G and then in H. The other two are in I and J , and from there one of them went to K and the other went his own way into a non-user External Code .
You can switch to another thread, for this double click on the stream. I want to see the K method. For this double click on MyCalss.K
Parallel Stacks will show the information, and the studio debugger will show the code for this location. Click Toggle Method View and see a picture of the history (hierarchy) of methods up to K.
Continue debugging up to 3 interrupts.
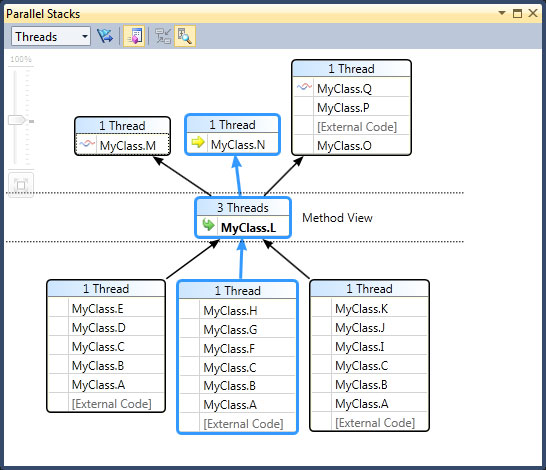
When multiple threads arrive in the same method, but the method is not at the beginning of the call stack, it appears in a different framework, as happened with the L method.
Double click on the method of L. We get this picture

Method L is also bold in the other two frames, so you can see where it will appear. To see which frames call the L method, switch the display mode ( Toggle Method View ). We get the following:
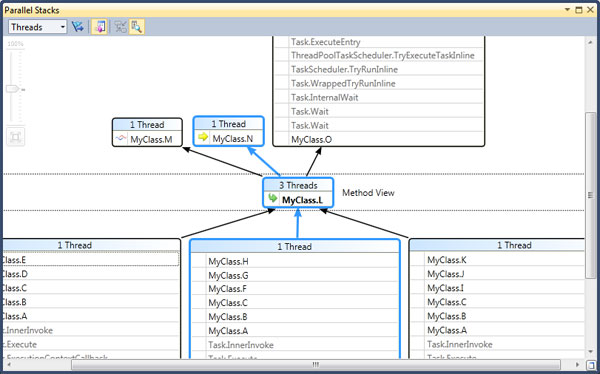
In the context menu there are items such as " Hexadecimal Display " and " Show External Code ". When you turn on the last mode, the diagram is larger than the previous one and contains information about non-user code .
We continue to run the program until the fourth interrupt.
This time the diagram will be very large and an autoscroll will come to the rescue, which will immediately take you to the right place. The Bird's Eye View also helps you quickly navigate through large charts. (a small button on the bottom right). Auto zoom and other joys help navigate the really large multi-threaded applications.

End the program (Shift + F5) or in the debug menu. Close all unnecessary windows with which we experimented in the past example and open new ones: Debug → Windows → Threads , Debug → Windows → Call Stack and sculpt them to the edges of the studio. Also open Debug → Windows → Parallel Tasks . This is what happened in the Parallel Tasks window.
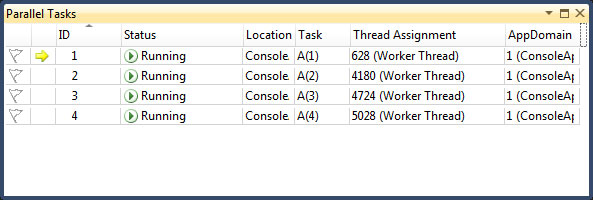
For each running task there is an ID that returns the value of the task property of the same name, the location of the task (if you hover the mouse on the Console , the whole stack of calls will appear) as well as the method that was adopted as the starting point of the task (start of the task).
The previous time, all tasks were marked as being performed, now 2 tasks are blocked for various reasons. To find out the reason you need to hover the mouse on the task.
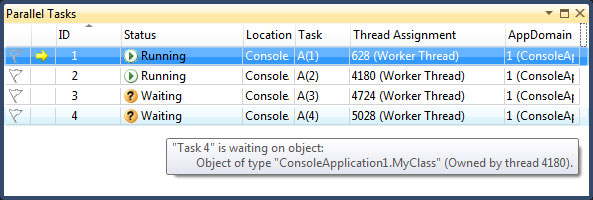
The task can be marked with a flag and monitor the further state.
In the Parallel Stack window, which we used in the previous example, there is a view switch from streams to jobs (upper left). Switch view to Tasks
As you can see from the screenshot - a new task 5 is executed, and tasks 3 and 4 are stopped. You can also change the look of the table - right mouse button on the column headings. If you turn on the display of the ancestor of the task (Parent), we will see who is the ancestor of task number 5. But for a better visualization of the relationship, you can turn on a special view - right click on the Parent → Parent Child View column.

Windows Parallel Tasks and Parallel Stack - synchronized. So we can see which task is running in which thread. For example, task 4. Double click on task 4 in the Parallel Tasks window, with this click you will synchronize with the Parallel Stack window and we will see the following picture

In the Parallel Stack window, in task mode you can go to the stream. For this PCM on the method and Go To Thread . In our example, we will see what happens with the O method.
We continue to the next point. Then sort the tasks by ID and see the following

There is no task 5 in the list, because it has already been completed. Problems 3 and 4 are waiting for each other and are deadlocked. There are 5 more new tasks from task 2, which are now scheduled for execution.
Let's go back to the Parallel Stack . A hint in the header of each tablet will tell you how many tasks are blocked, how many are expected and how many are executed.
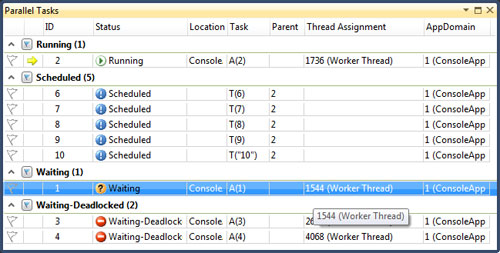
Tasks in the task list can be grouped. For example, we group by status - PCM in the Status column and Group by Status . Result on the screenshot:
A few more features of the Parallel Tasks window: in the context menu, you can freeze tasks, you can freeze the main task flow.
Using these two powerful tools, you can debug large and complex, multi-threaded applications. Watch for the result and order of tasks. Plan the correct order of tasks. Build programs with a minimum number of errors associated with a misunderstanding of the work of multi-threaded programs.
Thank you for your attention and fewer errors for multithreaded applications :)
We will learn:
- How to watch call stacks of threads
- How to view the list of tasks created in our application (System.Threading.Tasks. Task )
- How to navigate the Parallel Tasks and Parallel Stacks debug windows
- We learn interesting and useful things in debugs with vs2010
Caution, a lot of pictures
Training
For the tests, we need VS 2010. The images in this article were obtained using the Intel Core i3 processor
')
Project code
Code for VB and C ++ languages can be found on this page.
using System;
using System.Threading;
using System.Threading.Tasks;
using System.Diagnostics;

class S
{
static void Main()
{
pcount = Environment.ProcessorCount;
Console .WriteLine( "Proc count = " + pcount);
ThreadPool.SetMinThreads(4, -1);
ThreadPool.SetMaxThreads(4, -1);

t1 = new Task(A, 1);
t2 = new Task(A, 2);
t3 = new Task(A, 3);
t4 = new Task(A, 4);
Console .WriteLine( "Starting t1 " + t1.Id.ToString());
t1.Start();
Console .WriteLine( "Starting t2 " + t2.Id.ToString());
t2.Start();
Console .WriteLine( "Starting t3 " + t3.Id.ToString());
t3.Start();
Console .WriteLine( "Starting t4 " + t4.Id.ToString());
t4.Start();

Console .ReadLine();
}

static void A( object o)
{
B(o);
}
static void B( object o)
{
C(o);
}
static void C( object o)
{
int temp = ( int )o;

Interlocked.Increment( ref aa);
while (aa < 4)
{
;
}

if (temp == 1)
{
// BP1 - all tasks in C
Debugger.Break();
waitFor1 = false ;
}
else
{
while (waitFor1)
{
;
}
}
switch (temp)
{
case 1:
D(o);
break ;
case 2:
F(o);
break ;
case 3:
case 4:
I(o);
break ;
default :
Debug.Assert( false , "fool" );
break ;
}
}
static void D( object o)
{
E(o);
}
static void E( object o)
{
// break here at the same time as H and K
while (bb < 2)
{
;
}
//BP2 - 1 in E, 2 in H, 3 in J, 4 in K
Debugger.Break();
Interlocked.Increment(<font color="#0000ff">ref bb);

//after
L(o);
}
static void F( object o)
{
G(o);
}
static void G( object o)
{
H(o);
}
static void H( object o)
{
// break here at the same time as E and K
Interlocked.Increment( ref bb);
Monitor.Enter(mylock);
while (bb < 3)
{
;
}
Monitor.Exit(mylock);

//after
L(o);
}
static void I( object o)
{
J(o);
}
static void J( object o)
{
int temp2 = ( int )o;

switch (temp2)
{
case 3:
t4.Wait();
break ;
case 4:
K(o);
break ;
default :
Debug.Assert( false , "fool2" );
break ;
}
}
static void K( object o)
{
// break here at the same time as E and H
Interlocked.Increment( ref bb);
Monitor.Enter(mylock);
while (bb < 3)
{
;
}
Monitor.Exit(mylock);

//after
L(o);
}
static void L( object oo)
{
int temp3 = ( int )oo;

switch (temp3)
{
case 1:
M(oo);
break ;
case 2:
N(oo);
break ;
case 4:
O(oo);
break ;
default :
Debug.Assert( false , "fool3" );
break ;
}
}
static void M( object o)
{
// breaks here at the same time as N and Q
Interlocked.Increment( ref cc);
while (cc < 3)
{
;
}
//BP3 - 1 in M, 2 in N, 3 still in J, 4 in O, 5 in Q
Debugger.Break();
Interlocked.Increment( ref cc);
while ( true )
Thread.Sleep(500); // for ever
}
static void N( object o)
{
// breaks here at the same time as M and Q
Interlocked.Increment( ref cc);
while (cc < 4)
{
;
}
R(o);
}
static void O( object o)
{
Task t5 = Task.Factory.StartNew(P, TaskCreationOptions.AttachedToParent);
t5.Wait();
R(o);
}
static void P()
{
Console .WriteLine( "t5 runs " + Task.CurrentId.ToString());
Q();
}
static void Q()
{
// breaks here at the same time as N and M
Interlocked.Increment( ref cc);
while (cc < 4)
{
;
}
// task 5 dies here freeing task 4 (its parent)
Console .WriteLine( "t5 dies " + Task.CurrentId.ToString());
waitFor5 = false ;
}
static void R( object o)
{
if (( int )o == 2)
{
//wait for task5 to die
while (waitFor5) { ;}

int i;
//spin up all procs
for (i = 0; i < pcount - 4; i++)
{
Task t = Task.Factory.StartNew(() => { while ( true );});
Console .WriteLine( "Started task " + t.Id.ToString());
}

Task.Factory.StartNew(T, i + 1 + 5, TaskCreationOptions.AttachedToParent); //scheduled
Task.Factory.StartNew(T, i + 2 + 5, TaskCreationOptions.AttachedToParent); //scheduled
Task.Factory.StartNew(T, i + 3 + 5, TaskCreationOptions.AttachedToParent); //scheduled
Task.Factory.StartNew(T, i + 4 + 5, TaskCreationOptions.AttachedToParent); //scheduled
Task.Factory.StartNew(T, (i + 5 + 5).ToString(), TaskCreationOptions.AttachedToParent); //scheduled

//BP4 - 1 in M, 2 in R, 3 in J, 4 in R, 5 died
Debugger.Break();
}
else
{
Debug.Assert(( int )o == 4);
t3.Wait();
}
}
static void T( object o)
{
Console .WriteLine( "Scheduled run " + Task.CurrentId.ToString());
}
static Task t1, t2, t3, t4;
static int aa = 0;
static int bb = 0;
static int cc = 0;
static bool waitFor1 = true ;
static bool waitFor5 = true ;
static int pcount;
static S mylock = new S();
}
* This source code was highlighted with Source Code Highlighter .
Parallel Stacks Window: Threads View (Streams)
Step 1
Copy the code into the studio in a new project and run in debug mode (F5). The program will compile, run and stop at the first breakpoint.
In the Debug → Windows menu , click on Parallel Stacks. Using this window, we can view several call stacks of parallel threads. The following figure shows the state of the program at the first stop point. The Call Stack window is activated in the same place in the Debug → Windows menu. These windows are available only during debugging. While writing code, they are simply not visible.
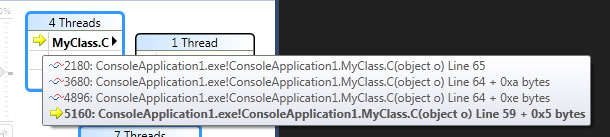
In the picture, the 4 threads are grouped together, because their stack frames belong to the same method context, which means that it is the same method (A, B, C). To view the thread ID you need to point at the heading "4 Threads". The current stream will be bold . The yellow arrow indicates the active stack frame in the current thread. To get more information you need to hover the mouse.
To remove unnecessary information or include (for example, the module name, shift, parameter names and their types, etc.), right-click on the table header in the Call Stack window (this is done in the entire Windows environment).
A blue box around it means that the current stream (which is bold) is part of those streams.
Step 2
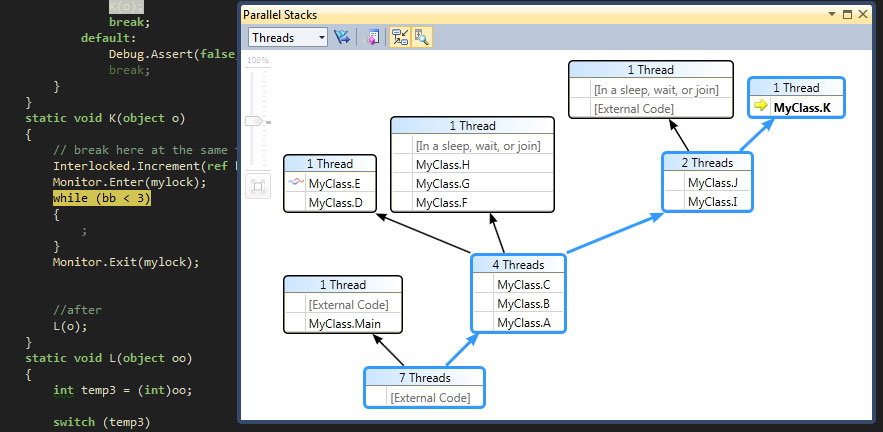
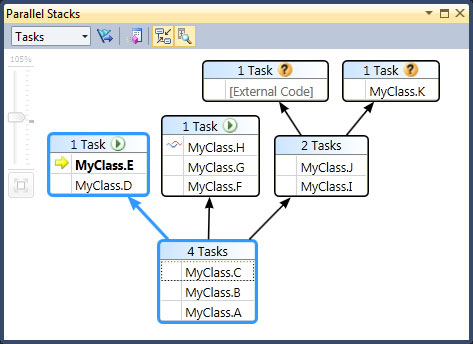
We continue the program to the second stopping point (F5). The next slide shows the status of flows in the second point.
In the first step, 4 threads came from methods A , B, and C. This information is still available in the Parallel Stacks window, but now these 4 streams have been developed further. One thread continued in D, then in E. The other in F , G and then in H. The other two are in I and J , and from there one of them went to K and the other went his own way into a non-user External Code .
You can switch to another thread, for this double click on the stream. I want to see the K method. For this double click on MyCalss.K
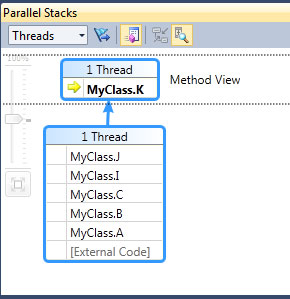
Parallel Stacks will show the information, and the studio debugger will show the code for this location. Click Toggle Method View and see a picture of the history (hierarchy) of methods up to K.
Step 3
Continue debugging up to 3 interrupts.
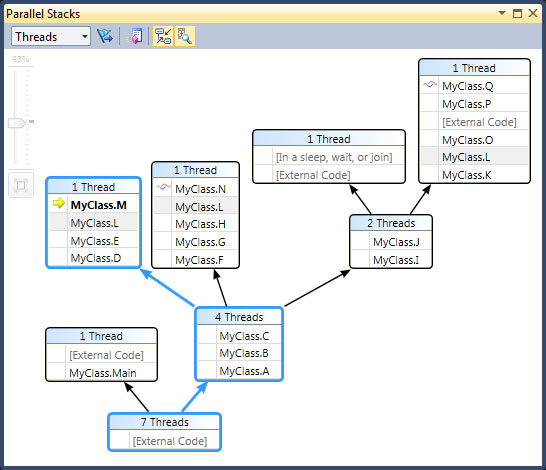
When multiple threads arrive in the same method, but the method is not at the beginning of the call stack, it appears in a different framework, as happened with the L method.
Double click on the method of L. We get this picture
Method L is also bold in the other two frames, so you can see where it will appear. To see which frames call the L method, switch the display mode ( Toggle Method View ). We get the following:
In the context menu there are items such as " Hexadecimal Display " and " Show External Code ". When you turn on the last mode, the diagram is larger than the previous one and contains information about non-user code .
Step 4
We continue to run the program until the fourth interrupt.
This time the diagram will be very large and an autoscroll will come to the rescue, which will immediately take you to the right place. The Bird's Eye View also helps you quickly navigate through large charts. (a small button on the bottom right). Auto zoom and other joys help navigate the really large multi-threaded applications.
Parallel Tasks Window and Tasks View in the Parallel Stacks window
Step 1
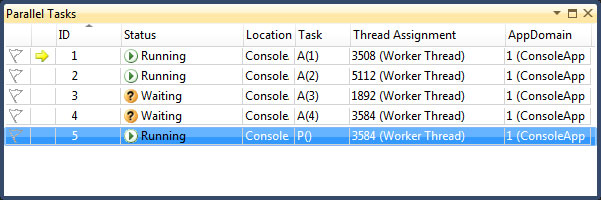
End the program (Shift + F5) or in the debug menu. Close all unnecessary windows with which we experimented in the past example and open new ones: Debug → Windows → Threads , Debug → Windows → Call Stack and sculpt them to the edges of the studio. Also open Debug → Windows → Parallel Tasks . This is what happened in the Parallel Tasks window.
For each running task there is an ID that returns the value of the task property of the same name, the location of the task (if you hover the mouse on the Console , the whole stack of calls will appear) as well as the method that was adopted as the starting point of the task (start of the task).
Step 2
The previous time, all tasks were marked as being performed, now 2 tasks are blocked for various reasons. To find out the reason you need to hover the mouse on the task.
The task can be marked with a flag and monitor the further state.
In the Parallel Stack window, which we used in the previous example, there is a view switch from streams to jobs (upper left). Switch view to Tasks
Step 3
As you can see from the screenshot - a new task 5 is executed, and tasks 3 and 4 are stopped. You can also change the look of the table - right mouse button on the column headings. If you turn on the display of the ancestor of the task (Parent), we will see who is the ancestor of task number 5. But for a better visualization of the relationship, you can turn on a special view - right click on the Parent → Parent Child View column.
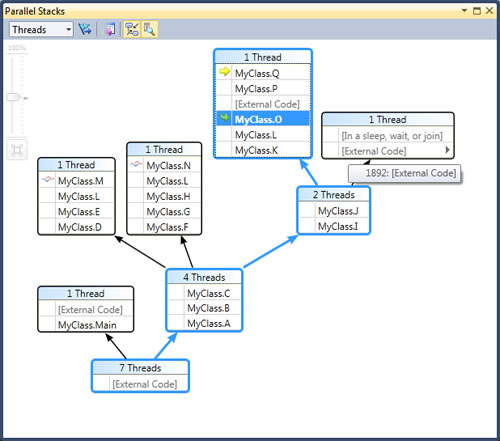
Windows Parallel Tasks and Parallel Stack - synchronized. So we can see which task is running in which thread. For example, task 4. Double click on task 4 in the Parallel Tasks window, with this click you will synchronize with the Parallel Stack window and we will see the following picture
In the Parallel Stack window, in task mode you can go to the stream. For this PCM on the method and Go To Thread . In our example, we will see what happens with the O method.
Step 4
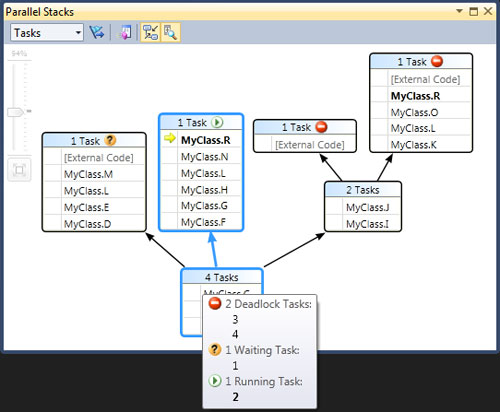
We continue to the next point. Then sort the tasks by ID and see the following
There is no task 5 in the list, because it has already been completed. Problems 3 and 4 are waiting for each other and are deadlocked. There are 5 more new tasks from task 2, which are now scheduled for execution.
Let's go back to the Parallel Stack . A hint in the header of each tablet will tell you how many tasks are blocked, how many are expected and how many are executed.
Tasks in the task list can be grouped. For example, we group by status - PCM in the Status column and Group by Status . Result on the screenshot:
A few more features of the Parallel Tasks window: in the context menu, you can freeze tasks, you can freeze the main task flow.
Conclusion
Using these two powerful tools, you can debug large and complex, multi-threaded applications. Watch for the result and order of tasks. Plan the correct order of tasks. Build programs with a minimum number of errors associated with a misunderstanding of the work of multi-threaded programs.
Literature
- Using the Parallel Stacks Window
- Using the Parallel Tasks Window
- Walkthrough: Debugging a Parallel Application (code samples here)
- Task Parallel Library
Video
- Parallel Stacks - new Visual Studio 2010 debugger window
- Parallel Tasks - new Visual Studio 2010 debugger window
- VS2010 Parallel Computing Features Tour
- Parallel Debugging in Visual Studio 2010
Daniel Moth blog
Thank you for your attention and fewer errors for multithreaded applications :)
Source: https://habr.com/ru/post/97817/
All Articles