Earth Gravitational Map
The GOCE satellite (launched by the European Space Agency in 2009 at a record low orbit of 255 km) finally collected data from all over the earth's surface, and for the first time scientists were able to compile the most complete and detailed map of Earth’s gravity , which was presented today at the Climate Congress in Norway.
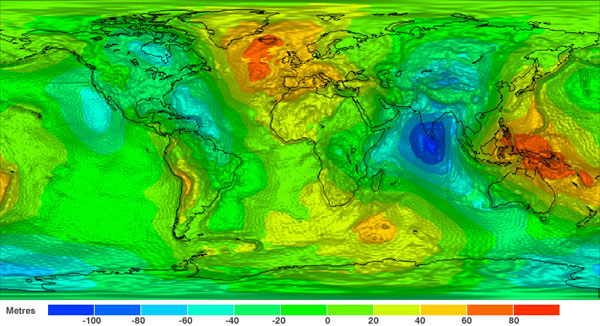
This map shows how diverse the different regions of our planet are in terms of their density and, accordingly, their mass. As can be seen, the most massive layers of the earth's crust lie in the region of Iceland. The ocean level (relative to the terrestrial ellipsoid) there is about 180 meters higher than in the region of India.
According to this map, you can calculate the terrestrial geoid - a figure reflecting the shape of the potential of gravity on Earth.
')

Experts claim that drawing the terrestrial geoid has an important practical value: scientists can better understand the causes of the movement of ocean masses around the planet, and in the future - create a more objective scale for assessing our position in space, since the scale “relative to sea level” is not very accurate. Roughly speaking, if we live supposedly at a height of “20 meters above sea level,” then raising the oceans by five meters could still flood our city, because in this place the geoid bends upwards. And he always bent up near the land.
In addition, the sea level has very different heights in different regions - for example, on the opposite coasts of Australia, it differs by almost 100 meters, so it’s not entirely correct to focus on it.
This map shows how diverse the different regions of our planet are in terms of their density and, accordingly, their mass. As can be seen, the most massive layers of the earth's crust lie in the region of Iceland. The ocean level (relative to the terrestrial ellipsoid) there is about 180 meters higher than in the region of India.
According to this map, you can calculate the terrestrial geoid - a figure reflecting the shape of the potential of gravity on Earth.
')
Experts claim that drawing the terrestrial geoid has an important practical value: scientists can better understand the causes of the movement of ocean masses around the planet, and in the future - create a more objective scale for assessing our position in space, since the scale “relative to sea level” is not very accurate. Roughly speaking, if we live supposedly at a height of “20 meters above sea level,” then raising the oceans by five meters could still flood our city, because in this place the geoid bends upwards. And he always bent up near the land.
In addition, the sea level has very different heights in different regions - for example, on the opposite coasts of Australia, it differs by almost 100 meters, so it’s not entirely correct to focus on it.
Source: https://habr.com/ru/post/97749/
All Articles