Draw a map in a WPF application
Recently, a production need has arisen — map a map of Russia on a form, with details down to the regions. At the same time you need:
The quality requirement is easily achieved when using vector graphics. And then I got the idea to use WPF - and what, draw a picture in Expression Blend, thereby obtaining a set of WPF controls. The rest - add "interactive" - a matter of technology.
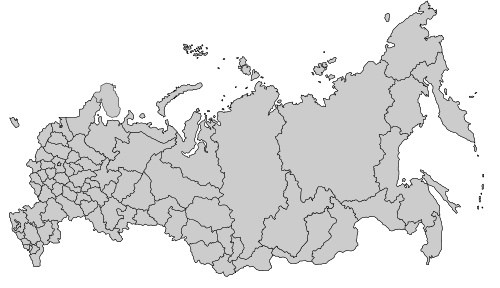
So, the very first thing to do was get the image itself. Our country is big, which is, of course, wonderful, but there were no desire to draw so many elements ourselves. This was not required - an excellent sample of the map of Russia was found in Wikimedia Commons:
This is just what you need! One moment is the SVG file. It was necessary to somehow convert it to XAML. As a result of the search, I came across a set of XamlTune , which has a console utility with the speaker name svg2xaml. She did an excellent job with her task, and soon I received a canvas with a lot of nested Path elements, which depicts our country. The resulting XAML looks like this:
Obviously, several copies of the canvas are used to draw the borders of the state and subjects.
Things are going well - it remains to display the map. It would seem that everything is very simple - we put the canvas on the form and enjoy. That's the way it is, only you can notice its very solid dimensions: Width = "1091.99" Height = "630.119". How to scale it? If you replace the canvas with a Grid, for example, when you resize a form, all parts of the map “disperse”. To avoid this, use the Viewbox control. Post it on the form as follows:
It is worth noting here that I put the outline with the map on the resources with the key “svg2”. The canvas will be compressed while maintaining the proportions to the current size of the ViewBox container. In this case, the absolute coordinates within the canvas will remain valid, and the layout of the map will not "go." Now you can style the mouse click handler, like this:
So a click handler will be defined for all Path elements. Well, etc. - in the style, you can define triggers, set properties, thereby providing the necessary appearance and behavior: further actions depend on your tasks and imagination. For example, you can select the boundaries of the region when you hover the mouse, or highlight the background when an event occurs, etc.
I needed an interactive map, i.e. so that you can work with its individual parts, including accepting user input. If this is not required, you can use the canvas with the map as a VisualBrush. You can do this, for example, like this:
To preserve the original aspect ratio of the canvas with the map, the Uniform value was set for the Stretch property of the brush. Of course, if we use VisualBrush, we will get a performance gain - less CPU resources and RAM will be required. In confirmation of this - the data from the profiler from the Visual Studio 2010 suite (the blue line of the graph is the CPU load):
1) Option with VisualBrush (allocation of a managed-memory ~ 11,36Mb):
2) Option with ViewBox (allocation of a managed-memory ~ 14,83Mb):
Therefore, if user input processing is not needed, the VisualBrush approach is preferable.
So, it’s quite simple and quick to solve the problem of working with a geographic map. It is in these situations that you begin to understand the full power of WPF technology. Not the most trivial task - getting an interactive and “rubber” (i.e. resistant to resizing) map - has come down to using the utility and “screwing” the styles. Very significant, in my opinion.
')
Sample source code
- depending on various conditions, change the appearance of map areas;
- the card must “perceive” user input and respond to it;
- you need to have a good quality “picture card” regardless of the monitor resolution.
The quality requirement is easily achieved when using vector graphics. And then I got the idea to use WPF - and what, draw a picture in Expression Blend, thereby obtaining a set of WPF controls. The rest - add "interactive" - a matter of technology.
So, the very first thing to do was get the image itself. Our country is big, which is, of course, wonderful, but there were no desire to draw so many elements ourselves. This was not required - an excellent sample of the map of Russia was found in Wikimedia Commons:
This is just what you need! One moment is the SVG file. It was necessary to somehow convert it to XAML. As a result of the search, I came across a set of XamlTune , which has a console utility with the speaker name svg2xaml. She did an excellent job with her task, and soon I received a canvas with a lot of nested Path elements, which depicts our country. The resulting XAML looks like this:
< Canvas x:Key ="svg2" Width ="1091.9919" Height ="630.11902" ClipToBounds ="True" >
< Canvas Name ="State_Outline" >
< Path Stroke ="#FF000000" StrokeMiterLimit ="4" Name ="polygon81" >
< Path.Data >
< PathGeometry FillRule ="Nonzero" Figures ="M715.671,134.212L715.368,133.002 717.637,134.061 718.771,132.926 720.359,131.338 722.704,128.994 724.141,130.733 724.897,130.733 726.787,128.843 728.527,126.801 731.854,125.289 734.274,127.104 732.913,130.885 732.913,133.002 731.325,134.59 728.829,135.725 726.107,136.784 723.385,136.784 721.343,138.826 718.091,137.691 716.427,135.271 715.671,134.212z" />
</ Path.Data >
</ Path >
<!-- ... -->
</ Canvas >
<!-- ... -->
</ Canvas >
Obviously, several copies of the canvas are used to draw the borders of the state and subjects.
Things are going well - it remains to display the map. It would seem that everything is very simple - we put the canvas on the form and enjoy. That's the way it is, only you can notice its very solid dimensions: Width = "1091.99" Height = "630.119". How to scale it? If you replace the canvas with a Grid, for example, when you resize a form, all parts of the map “disperse”. To avoid this, use the Viewbox control. Post it on the form as follows:
< Viewbox Child ="{StaticResource svg2}" Stretch ="Uniform" />
It is worth noting here that I put the outline with the map on the resources with the key “svg2”. The canvas will be compressed while maintaining the proportions to the current size of the ViewBox container. In this case, the absolute coordinates within the canvas will remain valid, and the layout of the map will not "go." Now you can style the mouse click handler, like this:
< Style TargetType ="{x:Type Path}" >
< EventSetter Event ="MouseDown" Handler ="mouseDownHandler" />
</ Style >
So a click handler will be defined for all Path elements. Well, etc. - in the style, you can define triggers, set properties, thereby providing the necessary appearance and behavior: further actions depend on your tasks and imagination. For example, you can select the boundaries of the region when you hover the mouse, or highlight the background when an event occurs, etc.
I needed an interactive map, i.e. so that you can work with its individual parts, including accepting user input. If this is not required, you can use the canvas with the map as a VisualBrush. You can do this, for example, like this:
< Window x:Class ="WpfApplication46.Window1" xmlns ="http://schemas.microsoft.com/winfx/2006/xaml/presentation" xmlns:x ="http://schemas.microsoft.com/winfx/2006/xaml" Title ="Window1" Height ="300" Width ="300" >
< Window.Resources >
< Canvas x:Key ="svg2" Width ="1091.99" Height ="630.119" >
<!-- ... ... -->
</ Canvas >
</ Window.Resources >
< Grid >
< Border Margin ="20" >
< Border.Background >
< VisualBrush Stretch ="Uniform" Visual ="{StaticResource svg2}" />
</ Border.Background >
</ Border >
</ Grid >
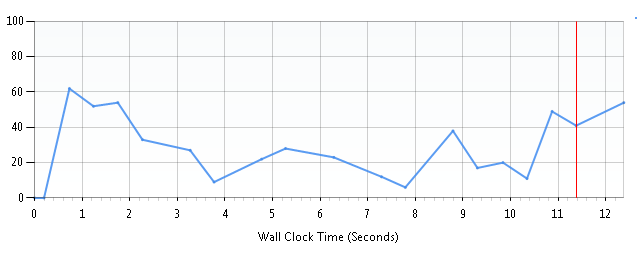
</ Window >To preserve the original aspect ratio of the canvas with the map, the Uniform value was set for the Stretch property of the brush. Of course, if we use VisualBrush, we will get a performance gain - less CPU resources and RAM will be required. In confirmation of this - the data from the profiler from the Visual Studio 2010 suite (the blue line of the graph is the CPU load):
1) Option with VisualBrush (allocation of a managed-memory ~ 11,36Mb):
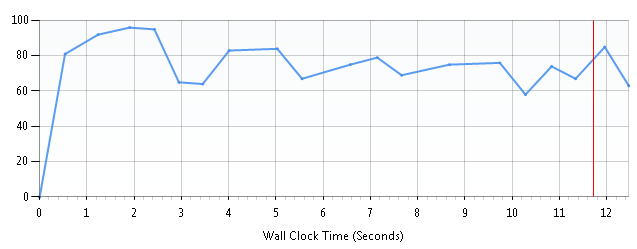
2) Option with ViewBox (allocation of a managed-memory ~ 14,83Mb):
Therefore, if user input processing is not needed, the VisualBrush approach is preferable.
So, it’s quite simple and quick to solve the problem of working with a geographic map. It is in these situations that you begin to understand the full power of WPF technology. Not the most trivial task - getting an interactive and “rubber” (i.e. resistant to resizing) map - has come down to using the utility and “screwing” the styles. Very significant, in my opinion.
')
Sample source code
Source: https://habr.com/ru/post/94945/
All Articles