collectd - collect system and user statistics
Question number 0 - why?
In a post about pnp4nagios, I wrote “Nagios / Pnp4Nagios is not a replacement for the system statistics collection complex”. Why do I think so? Because 1) the system status statistics is extensive and includes many indicators 2) it does not always make sense to monitor them, or rather to generate alerts. For example, knowing how many I / O operations make a disk or context switching takes place well, but almost never critical. Well, besides, Nagios is simply not meant for that. In this article I will not make a complete description of the system, I will confine myself to especially interesting moments, from my point of view.
Question number 1 - why collectd?
')
The main points why I chose collectd from Munin, Cacti and others:
- Scalability
- Lightness
- Concept - everything has plugins
- Data collection and recording is divided
- Number of indicators collected
- Extensibility
The general scheme of work collectd:
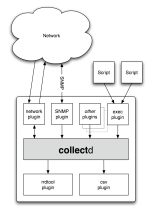
Scalability
To take data to the central node (s), push is used (as opposed to Cacti / Munin’s poll / pull). More than one node can store data and moreover, it is possible to separate data for storage on different nodes. Data transfer is handled by a separate plugin - network.
Lightness
The main daemon and plugins are written in C and easily survive the 10-second data collection interval without loading the system.
Everything has plugins
CPU load data collector - plugin. Information about the processes - plugin. Record and create RRD / CSV - plugin.
Data collection and recording is divided
Data can be both read and written. collectd divides plug-ins into "readers" and "writers." Those that collect information - readers. After while the data is read, it is sent to registered writers, who can generally be any. The most "popular" writer is the network plugin which sends data to the central node and RRDTool, as RRD, as a rule, implies statistics. Thus, a node can have both statistics in the RRD and send data for further processing.
Number of indicators collected
Currently there are more than 90 basic plugins for collecting information about the system and applications.
Extensibility
To add your own data sources exist:
- The exec plugin is generally a standard extension method - the program is started, the data output to stdout is processed, but collectd plus also has here - the program does not have to exit after outputting values, moreover, it is recommended to start and output data in a loop, saving resources on startup, which especially relevant for scripts.
- Python / Perl / Java Binding - are both readers and writers, more detailed description below
Expansion due to bindings
Bindings are essentially plugins for accessing internal collectd mechanisms from other languages and writing plugins for them. Java / Perl / Python are currently supported. For example, for Python, the interpreter starts at the start of collectd, is contained in memory, saving startup resources every few seconds and allows scripts to have access to the API.
So the script can register as a data provider (reader) and / or as a writer, the registered procedure will be called every time interval specified in the configuration. If everything is clear with the reader, then a separate attention should be paid to the writer - your script can easily be embedded to process all the data passing through, i.e. You can, for example, make your database of stored values. A simple example of such a Python plugin is in the project documentation.
Interesting and useful features of plugins
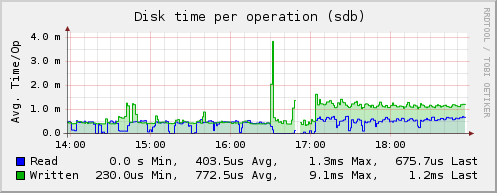
- First of all, I liked the disk plugin - it out of the box knew how to measure the average response time of a disk:
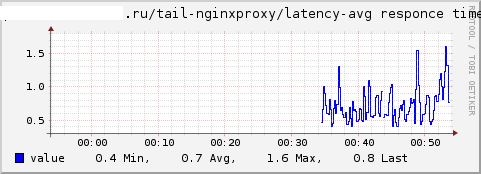
- The tail plugin - allows you to read files as tail (1) and pull values using regexps. You can take the minimum / maximum / average from the defaulted values, calculate the total number of records, sum up, for example, for nginx you can collect statistics on response time and requests for the locus like this:
- Add a record about the service time of the request to the nginx log:
log_format maintime '$remote_addr - - [$time_local] reqtime=$request_time "$request" $status $body_bytes_sent "$http_referer" "$http_user_agent" "$host" upstream: $upstream_addr gzip:"$gzip_ratio"'; - Create an entry in the collectd config:
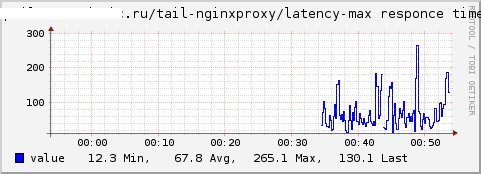
 LoadPlugin tail
 <Plugin "tail">
         <File "/var/log/nginx/somesite.access.log">
                 Instance "nginxproxy"
                 <Match>
                         Regex "reqtime = ([0-9] + \\. [0-9] +)"
                         DSType "GaugeMax"
                         Type "latency"
                         Instance "max responce time"
                 </ Match>
                 <Match>
                         Regex "reqtime = ([0-9] + \\. [0-9] +)"
                         DSType "GaugeAverage"
                         Type "latency"
                         Instance "avg responce time"
                 </ Match>
                 <Match>
                         Regex ". *"
                         DSType "CounterInc"
                         Type "derive"
                         Instance "requests"
                 </ Match>
         </ File>
 </ Plugin>
We obtain graphs of the total number of requests, the maximum response time and the average response time, respectively: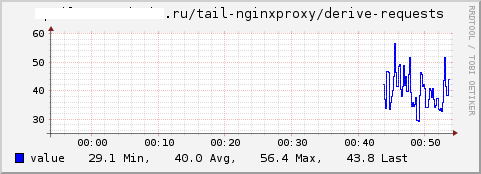
The Curl plugin has similar capabilities. - Add a record about the service time of the request to the nginx log:
- Plug-in processes - can collect information on the number of running processes that fall under the filter, the number of their threads, the size of the memory, input / output, for example:
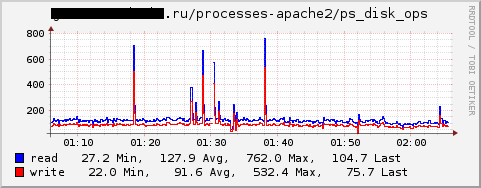
In this case, the data is not entirely correct - it is not read / write disk operations, but in general everything, i.e. write to socket is also counted. I informed the authors, maybe they will fix it in the next version. - UnixSock plugin will allow to exchange data using a simple text protocol , in particular, you can receive or send the value of the counter. With this plugin, integration into Nagios is possible.
Other features
Filters and chains
Starting from version 4.6, a filter and chain mechanism appeared, similar to chains in iptables. Using this mechanism, you can filter data, for example, to cut off values for which the timestamp is more or less than the current time by N, which can be useful if a clock gets stuck on a server. RRD will get time from the future and the readings will be distorted.
Notification and threshholds
The basic system of notifications and threshold values appeared since version 4.3. Similarly, readers and writers, there are "producers" and "consumers" - the first produce notifications, the second process them. In particular, the Exec plugin can both respond to notifications, for example, run a script, and transmit notifications from scripts.
By configuring a set of threshold values, you can create alerts for deviations from the norm. However, it should be understood that these basic capabilities do not replace the same Nagios. For full-fledged work with Nagios, you can use the bundled collectd-nagios program that allows you to poll the socket created by the UnixSock plugin and return the result in a standard format for Nagios'a
disadvantages
I can only rank the display system of graphs as disadvantages. Considering that about 200 tons of counters can be generated from a single host, visualization becomes not in the last place. Standard interface collection3 is not bad, but far from perfect. To date, several independent graph display systems are being developed, but I cannot recommend any yet.
Other
One of the developers of Sebastian Harl (tokee) is the maintainer of a package in Debian, therefore there is almost always the latest version in backports
Source: https://habr.com/ru/post/93205/
All Articles