Why use TOR?
Introduction
I will not breed paranoid tales that the NSA and the FSB is following everyone. We just take for a basic thesis that tor and i2p are “our everything”. Unfortunately, in the context of TOR, one can often hear only about silkroad and child pornography. Like, hotbed, swinging and attempting.
I manage several tor-exit nodes and i2p routers. To avoid questions, my employer has nothing to do with them: all these nodes are exclusively at my expense, in my free time from work. The oldest of them is almost a year old, the youngest is about 4 months. During this time, I have not received any abuse report (I myself work in the hosting business, so I am well aware of the process of reaction to the “abuzu” - it is first of all sent to the client).
Despite the lack of abuse, the question remained: why do people use TOR?
')
Control over the exit node allows you to look at passing traffic. It is clear that we exclude all encrypted traffic (TLS, SSH), as well as all traffic to .onion nodes. However, among the rest, we can look at the approximate distribution of resources in popularity.
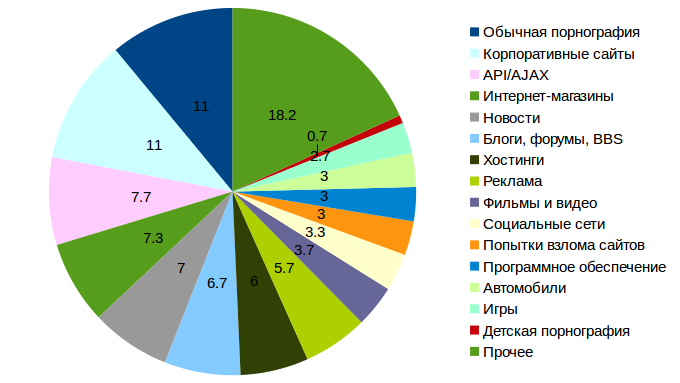
Looking ahead, a slightly simplified answer to the question of the article:
(more detailed table - at the end of the article)
Measurement Methodology
We used data from several exit nodes in Russia, France and Germany. Data was collected during the week using pcap, with the following line:
while true; do tshark -i venet0 -O http-Y http.request -T fields -e http.request.full_uri >> http_log7; rm / tmp / wire *; done
(tshark is buggy and periodically crashes, for this while / true. Instead, it extracts the URI from http requests in its purest form)
Before the start of data collection, all the nodes “settled down” for about three weeks (since the last restart) and all the tor drove away all the available band. A total of 3.9 million hits were recorded, js / css / ico / xml files were dropped from them, 3.7 million remained.
Analysis
I sketched the simplest script: github.com/amarao/url_prober for analysis.
Let's start with a simple - top visits, top domains, etc. Since there was no user tracking, the only thing we can operate with is the number of hits.
Top10 most visited pages (address, number, percentage of the total):
cloud.tvigle.ru//img/zero_rkm_chk.gif 193330 hits, 5.73%
dmg.digitaltarget.ru 83905 hits, 2.48%
ib.adnxs.com/getuid 65007 hits, 1.93%
stat.tvigle.ru/track 42513 hits, 1.26%
asg.vidigital.ru 31966 hits, 0.95%
www.google-analytics.com/__utm.gif 31259 hits, 0.93%
advombat.ru/api/id 23363 hits, 0.69%
x.ulogix.ru/match/digitaltarget 23040 hits, 0.68%
blurb.vidigital.ru 22726 hits, 0.67%
tags.bluekai.com/site/5400 22488 hits, 0.67%
As we see, the most frequent pages - service and related to tracking users advertising networks - nothing interesting.
Next comes the top11 domains with the top of the domain pages:
 cloud.tvigle.ru (243405 hits, 7.21%)
     http://cloud.tvigle.ru//img/zero_rkm_chk.gif 193330
     http://cloud.tvigle.ru/api/player/46/ 18696
  photo.tvigle.ru (116943 hits, 3.46%)
     http://photo.tvigle.ru/resource/rf/flv_lst/232904/src.jpg 1696
     http://photo.tvigle.ru/resource/rf/flv_lst/232899/src.jpg 1602
  mc.yandex.ru (110897 hits, 3.28%)
     http://mc.yandex.ru/watch/219670 15381
     http://mc.yandex.ru/watch/27181436 15212
  www.tns-counter.ru (107708 hits, 3.19%)
     http://www.tns-counter.ru/V13a***R%3Ehttp://forum.kinomania.ru/showthread.php 792
     http://www.tns-counter.ru/V13a***R%3Ehttp://brandcase.info/auto/index.php 153
 ib.adnxs.com (91854 hits, 2.72%)
     http://ib.adnxs.com/getuid 65007
     http://ib.adnxs.com/ttj 14706
  asg.vidigital.ru (79994 hits, 2.37%)
     http://asg.vidigital.ru/ 31966
     http://asg.vidigital.ru/1/3414/c/v/2 7688
  bcp.crwdcntrl.net (44450 hits, 1.32%)
     http://bcp.crwdcntrl.net/5/c=2962 22309
     http://bcp.crwdcntrl.net/5/ct=y/c=2962 1377
 www.google-analytics.com (44145 hits, 1.31%)
     http://www.google-analytics.com/__utm.gif 31259
     http://www.google-analytics.com/collect 11003
  ad.adriver.ru (44087 hits, 1.31%)
     http://ad.adriver.ru/cgi-bin/merle.cgi 22142
     http://ad.adriver.ru/cgi-bin/rle.cgi 9378
  stat.tvigle.ru (42514 hits, 1.26%)
     http://stat.tvigle.ru/track/ 42513
     htthttp: //stat.tvigle.ru/track/ 1
 vk.com (38796 hits, 1.15%)
     http://vk.com/share.php 9811
     http://vk.com/widget_community.php 9744
     http://vk.com/al_photos.php 6214
Again in the top are solid banner networks and trackers, with rare exceptions in the form of vk.com (social network) and tvigle.ru (online cinema). For the sake of vk.com, I even had to make top11, not top10.
So it will not work. And what are people looking at? Legend says that there should be extremeism, suicide, drugs, felines, porcotics, child pornography, oppositionists and other prohibited things. Well, the top method doesn't work. Let's proceed differently:
Let's take all the resources for which there were at least a few dozen hits (for example, 10), select about 300 of them and make a selection of pages for each of them that were visited at least several times (more than 1). Take these pages at least 4 pieces (for each approached domain), try to classify them manually. This will give us a statistical view of which sites users have visited.
Then the fun begins. I manually reviewed this 300 randomly selected links. The links themselves, with minimal moderation (scored urls in case of clinical danger takedown) can be found here .
It took me about a week for this process. This task turned out to be more difficult than it seems, because how will you classify the Brazilian website without an English version, which is dedicated to what is not clear? Plus, you will not believe how boring it is to look at sites that are not interesting. At first I wanted to make a sample of 500 sites, but at the two hundredth site I was completely exhausted, so three hundred is my personal heroic feat. Despite the fact that the surveyed results are only 300, this is a random sampling among the “visited” nodes during the week, and normalized by domain — that is, short-term bursts of popularity on the sample should not significantly affect the result.
Below are the results of the classification. They may seem too large grouped, but I really was not interested in sorting out different online stores of cakes and purses.
Full links otsmotrennogo, along with a script for random sampling, posted here .
| Category | Percent |
| Ordinary pornography | 11.0% |
| Corporate sites | 11.0% |
| Online stores | 7.3% |
| News sites | 7.0% |
| HTTP-based API | 7.7% |
| Blogs, forums, BBS | 6.7% |
| Advertising and banner networks | 5.7% |
| Films, videos (except trackers) | 3.7% |
| Social networks | 3.3% |
| Hosting Services | 3.3% |
| Software | 3.0% |
| Attempts to hack sites | 3.0% |
| Cars | 3.0% |
| Image or file hosting | 2.7% |
| Games | 2.7% |
| Pages for search engines (SEO) and landing'i. | 2.3% |
| Pages with information of a different (innocent) type | 2.3% |
| Sport and travel | 1.7% |
| The property | 1.7% |
| Hobby | 1.7% |
| Religion and esoteric (including cult sites) | 1.3% |
| Other (goverment, dating, instant messaging, torrents, 1 pc each) | 1.3% |
| Music and audiobooks | 1.3% |
| Sites with malware and frankly fraudulent | 1.3% |
| Job Sites | 1.3% |
| Child pornography | 0.7% |
| Webmail | 0.7% |
| Sites of medical organizations | 0.7% |
| Educational sites | 0.7% |
Remarks: in the category “corporate sites” and “online stores” only sites with innocent content for which there is no claim have been included. Since I have not met a single site with illegal goods, the categories “drug sites”, “fake documents”, “weapons” and “slave trade” are absent in the list above.
findings
- Most of the Internet resources (the white part of it), which are visited via TOR, does not have any criminal component and does not differ much from regular surfing.
- A noticeable part of the traffic is devoted to the reproduction of homo sapiens.
- The white Internet still has CP, but its share in visits is less than a percent.
- TOR can be used and is used to conduct attacks on sites.
- Drugs and illegal substances, weapons, explosives, etc. was not found.
- There is almost no political activity in TOR.
I was a little wondering why people use TOR to order cakes in an online store, but my colleagues from work suggested to me that some of them turn on TOR on their home router and use it “for everything”, that is, TOR goes through ordinary household traffic of a home user.
I repeat once again, only http-traffic was taken into account, which is accessed from exit-nodes. All onion-sites and non-http traffic to the white Internet remained behind the scenes.
PS If you do not use HTTPS, then any exit-node operator can see all your “white” traffic, including cookies and passwords.
UPD: In connection with numerous questions about non-inclusion of .onion sites in the sample, komachi suggested a link to the publication www.dailydot.com/politics/tor-dark-net-study-size , which states that hidden sites occupy about 3.4% of the total traffic.
Source: https://habr.com/ru/post/92787/
All Articles