VS 2010: Debugging Innovations
 This is the twenty-first article in the series on the release of VS 2010 and .NET 4. Today’s post will tell you about some nice improvements in usability that came with the debugger in VS 2010.
The VS 2010 debugger contains tons of great features such as Intellitrace (also known as the historical debugger), a new parallel / multi-thread debugging feature and debug dump support that deservedly attract attention if we are talking about a new version.
In today's post, I will start talking about some small, but nonetheless pleasant moments of usability during debugging, which appeared with VS 2010.
')
Stop point labels
VS 2010 adds new functionality for more convenient management of debugger breakpoints. One of the really convenient features is “Stoppoint Labels”, they allow you to better group and filter points in your project.
In previous versions of Visual Studio, you had to manage each debugger breakpoint as a separate element. Managing each point is a tedious and painful thing, especially in large projects, when you want to save certain logical groups of breakpoints, which you can enable or disable depending on what you are debugging. Using the new VS 2010 feature “stopping point labels”, you can now specify the name of this “group” of points and manage them as one.
Group multiple stop points together using a label.
Below is a screenshot of the breakpoint window in Visual Studio 2010. This list contains all the breakpoints of my project (in this case, ASP.NET MVC 2):

The first and last points in the list stop the debugger when the Controller instance is created.
Using VS 2010, I can select these two points, then right-click on them and select “Edit labels ...” in order to give them a name.

Below is the window that appears when you click “Edit labels”. We can use it to create a new string label for our breakpoints, or select an existing label. In our case, we will create a new label with the name “Lifetime Management” to describe two points:

When we click the OK button, our two selected points will be grouped under the “Lifetime Management” label created:

Filter and sort breakpoints using labels
We can use the “Search” drop-down list to quickly filter or sort breakpoints by label. Below we show only those points that are labeled “Lifetime Management”:

Turn on / off stopping points via tags
We can also enable or disable groups of breakpoints. It is enough to filter groups by tags, Ctrl-A to select all points, and then activate or deactivate them as needed:

Import / Export Stoppoints
Now VS 2010 supports importing / exporting breakpoints to XML files and you can transfer them to another developer, attach them to an error report, or simply reload later.
To export only a specific subset of breakpoints, you can filter them by label, and then click “Export breakpoint” in the Breakpoints window:

Above, I filtered out my points to export only two specific points (specific to my mistake). I can export the data points to an XML file, and then attach them to the error report or by mail, which will allow another developer to easily set up the debugger on another machine.
Pinned DataTips
Visual Studio 2010 also contains an interesting feature called “pinned DataTips,” which allow you to track variable and expression values in debug mode.
Just hover over a variable or expression in debug mode and you will see a help hint that displays the value, and then click on the new “clip” to pin.

You can fix as many DataTips as you want. In addition, by fixing high-level variables, you can delve into the internal properties of this variable and fix internal variables.
Below, I fixed three variables: “category”, “Request.RawUrl” and “Request.LogonUserIdentity.Name”. Note that the last two variables are internal properties of the “Request” object.

Linked Comments for Pinned DataTips
By hovering the mouse over any fixed DataTip, you will see additional interface elements:

By clicking on the DataTip comment button, you can optionally add a comment to it:

Which makes it very convenient to attach and track debug comments:

Pinned DataTips are available in debugging sessions and Visual Studio.
Pinned DataTip's are available in several debugger sessions. This means that if you stop the debugger, make changes to the code, and then recompile and rerun the new debugging session, then all pinned Datatips will remain in their original places, as well as comments attached to them.
Pinned DataTips can be used in multiple Visual Studio sessions. This means that you can close the project, close Visual Studio, and later open the project and make sure that all pinned DataTi'p'y in place, and with them their comments.
View the value of the previous debug session
How many times have you stopped the debugger, only to go back to your code and say:
what the x $ # nya! - what was the value of this variable just now ???
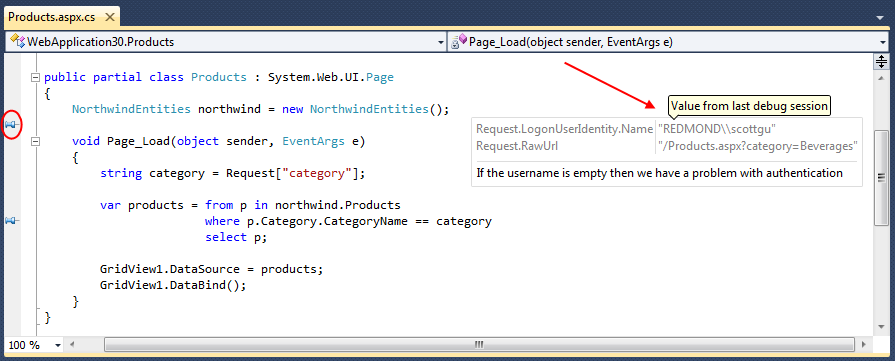
One of the nice things about DataTips is the ability to track your last value from a debug session and you can view these values in the VB / C # code editor, even if you are out of debug mode .
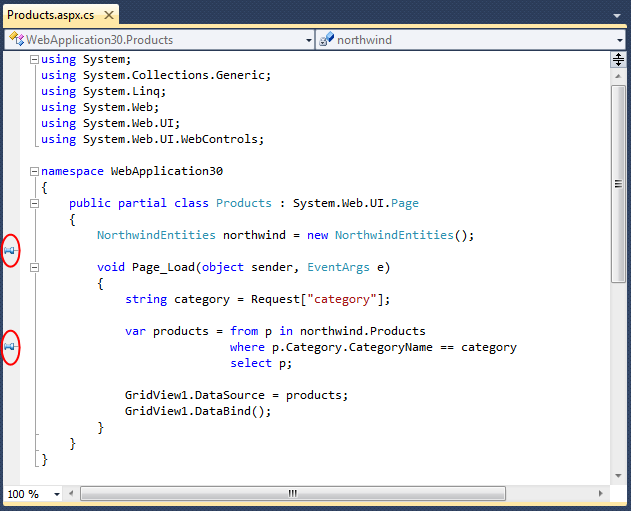
DataTips are hidden by default when you are in the code editor and outside the debugging session. In the left part of the indent of the code editor, you will find clips for each pinned DataTip:

Hovering the mouse on the fixed DataTip you will see it on the screen. The screenshot below shows what happens when I hover the cursor over the first clip in the editor, it will display the value of the last debugging session of the “Request” object and a comment:

This makes it easier to track the status and conditions by switching between debugging and code editing modes.
Importing and exporting pinned DataTips
As I mentioned earlier in this article, pinned DataTips are saved by default for all Visual Studio sessions.
VS 2010 also supports importing or exporting pinned DataTips to XML files, which you can later transfer to other developers, attach to error reports, or reload in the future.

Together with support for importing / exporting breakpoints, this functionality makes it much easier to exchange various debugger and
Results
Visual Studio 2010 contains a number of excellent innovations for the debugger, both small and huge.
Today's post revealed some nice improvements to the debugger usability. All of the above features are supported in Visual Studio Professional Edition (pinned DataTips are also available in Visual Studio 2010 Express Editions)
I will talk about some of the great innovations such as Intellitrace, parallel / multithreaded debugging and dump analysis in the following articles.
Source: https://habr.com/ru/post/92007/
All Articles