Debugging EXC_BAD_ACCESS on Mac OS X and iPhone
Hello! In this article I will try to talk about how you can make your life easier when debugging iPhone and Mac applications. It is about debugging EXC_BAD_ACCESS exceptions, one of the most unpleasant in nature.
The EXC_BAD_ACCESS exception occurs when we try to send a message to an object that has already been released (released). The situation is usually complicated by the fact that by the time the error pops up, the call stack no longer contains information that could help us. That is, it is not clear which object was released. And, all the more, it is not clear where in the code it was released :). It becomes even more fun if the application is multi-threaded.
Fortunately, the guys from Apple did their best to help us. They created a stub class NSZombie . If you turn it on I will support it (how to do it - I’ll tell you below), after deleting each object in its place (that is, by its address in memory), the “zombie” will live and receive messages, which will allow you to determine which object released and fix the error.
So, let's begin. One day, your iPhone or Mac application started to crash and you see the following message in the debugger console:
')
Program received signal: “EXC_BAD_ACCESS”.
And, in fact, nothing more. The call stack most likely did not help you either.
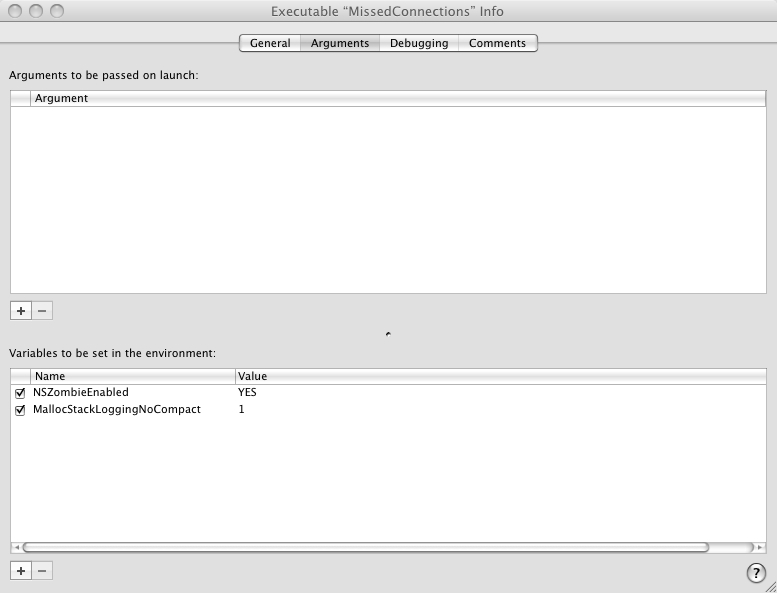
In the Groups & Files window (on the left in xCode ) find the Executables branch. Right-click on the executable file of your application and select Get Info in the drop-down menu. In the window that appears, open the Arguments tab and add two environment variables: NSZombieEnabled and MallocStackLoggingNoCompact . Set NSZombieEnabled to YES , and MallocStackLoggingNoCompact to 1 . How it should look is shown in the screenshot:
Now start your application and repeat the steps necessary to reproduce the error. In the debugger console, instead of the EXC_BAD_ACCESS message, you should see something like this:
This means that once you had a CFString object at the address 0x42a5060 . He has already been released, and your program does not let up and tries to send him a retain message. It remains to find this object and find in the code the place where the extra release was called. Either not caused by retain , depends on the specific situation :)
The following will help you: in the debugger console, type the following command:
Instead of 1393, you should enter your process ID (PID). You can view it in the console error message immediately after the application name. And instead of 0x42a5060, enter the address of the object that was freed (you can also look in the error message).
As a result, your eyes will appear a terrible picture like this:
Do not worry, everything is not as scary as it might seem at first glance. Close to the bottom, look for the names of the classes and methods that are present in your code. That is, written by you. Somewhere there hid the malicious call release . Search and correct.
PS Out of the corner of my eye, I read somewhere that it is possible to catch such errors using Instruments / ObjectAlloc. I would be very grateful if someone gave me a vodka ... Oh, a tip
The EXC_BAD_ACCESS exception occurs when we try to send a message to an object that has already been released (released). The situation is usually complicated by the fact that by the time the error pops up, the call stack no longer contains information that could help us. That is, it is not clear which object was released. And, all the more, it is not clear where in the code it was released :). It becomes even more fun if the application is multi-threaded.
Fortunately, the guys from Apple did their best to help us. They created a stub class NSZombie . If you turn it on I will support it (how to do it - I’ll tell you below), after deleting each object in its place (that is, by its address in memory), the “zombie” will live and receive messages, which will allow you to determine which object released and fix the error.
So, let's begin. One day, your iPhone or Mac application started to crash and you see the following message in the debugger console:
')
Program received signal: “EXC_BAD_ACCESS”.
And, in fact, nothing more. The call stack most likely did not help you either.
In the Groups & Files window (on the left in xCode ) find the Executables branch. Right-click on the executable file of your application and select Get Info in the drop-down menu. In the window that appears, open the Arguments tab and add two environment variables: NSZombieEnabled and MallocStackLoggingNoCompact . Set NSZombieEnabled to YES , and MallocStackLoggingNoCompact to 1 . How it should look is shown in the screenshot:
Now start your application and repeat the steps necessary to reproduce the error. In the debugger console, instead of the EXC_BAD_ACCESS message, you should see something like this:
2010-01-25 14:35:24.840 MyApplication[1393:20b] *** -[CFString retain]: message sent to deallocated instance 0x42a5060This means that once you had a CFString object at the address 0x42a5060 . He has already been released, and your program does not let up and tries to send him a retain message. It remains to find this object and find in the code the place where the extra release was called. Either not caused by retain , depends on the specific situation :)
The following will help you: in the debugger console, type the following command:
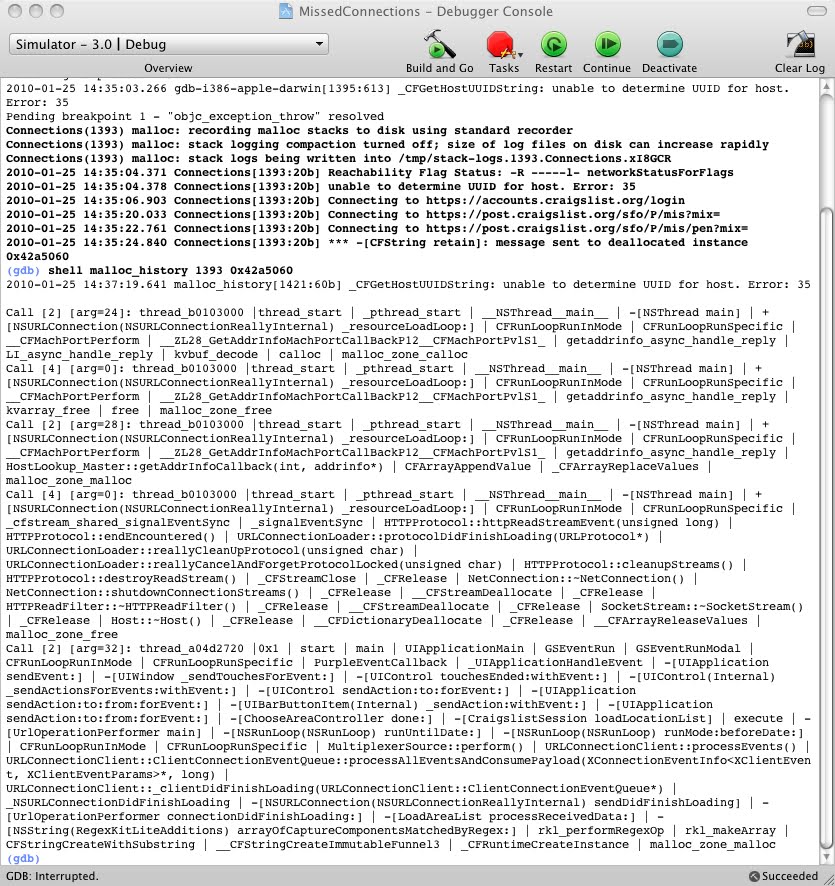
shell malloc_history 1393 0x42a5060Instead of 1393, you should enter your process ID (PID). You can view it in the console error message immediately after the application name. And instead of 0x42a5060, enter the address of the object that was freed (you can also look in the error message).
As a result, your eyes will appear a terrible picture like this:
Do not worry, everything is not as scary as it might seem at first glance. Close to the bottom, look for the names of the classes and methods that are present in your code. That is, written by you. Somewhere there hid the malicious call release . Search and correct.
PS Out of the corner of my eye, I read somewhere that it is possible to catch such errors using Instruments / ObjectAlloc. I would be very grateful if someone gave me a vodka ... Oh, a tip
Source: https://habr.com/ru/post/90725/
All Articles