Debugging JMeter Test Plan
In a previous post about JMeter, I described the creation of a primitive load test. When developing more complex scenarios, you can’t do without debugging. Unfortunately, in JMeter this technique is not entirely obvious. Below on a simple example I will show several techniques for debugging a test plan. At the same time I will demonstrate the use of such elements as HTTP Request Defaults, Regular Expression Extractor, If Controller and some others.
We will test the search mechanism on the site. Let the script take a word or phrase from a file, ask a question to a search engine, get an answer in the form of one or several pages, randomly select one of the pages, just randomly select one of the links and follow it. Total three requests, except for special cases (when little is found or nothing is found).
Rushed.
Run the JMeter GUI and rename the proposed empty test plan (Test plan) to the Search test for the order (in general, today I will try to behave culturally and, in particular, to devote time to intelligible naming of script elements, this helps). Right-click on the Search test element in the tree on the left and, saying Add-> Config element-> HTTP Request Defaults , we’ll enter the server address there
')
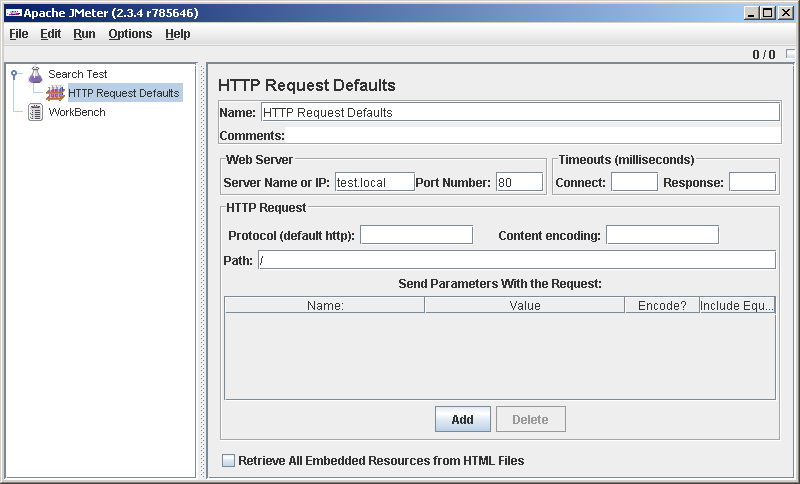
I started HTTP Request Defaults to not enter the server address in each request. And when will it have to be changed? Avoid duplication. I was going to behave culturally, so I try.
Search Test-> Add-> Thread Group . Here we leave everything by default.
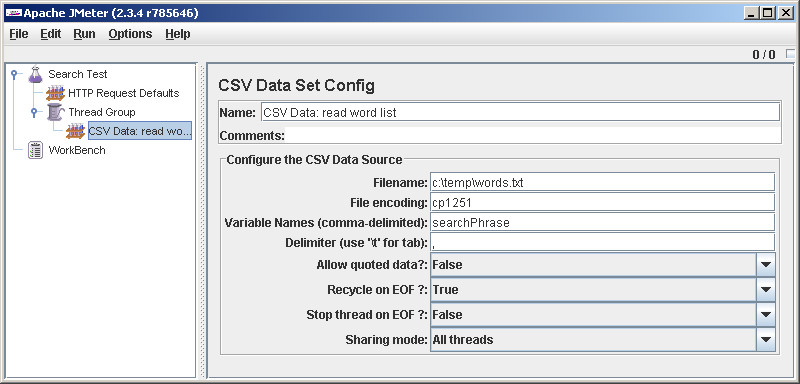
Thread Group-> Add-> Config Element-> CVS Data Set Config . With the help of this element we will read our words from the file, in each line on request.
By the way, we already have something to debug. The script does not go anywhere yet, but already reads something from a file and puts it into a variable (I called it searchPhrase). The sooner we start testing, the healthier we will be. Let's add items to debug.
Thread Group-> Add-> Sampler-> Debug Sampler .
Thread Group-> Add-> Listener-> View Results Tree . Here and there we leave all the default settings.
Save ( File-> Save ), run ( Run-> Clear All , Run-> Start ). We look in the View Results Tree and see that the script, as we wanted, was executed once. Click on the single result in the Results Tree ( Debug Sampler ) and go to the third tab Response data. In the last line we see: searchPhrase = test . Just in my first line of the file with the words test is written. Hooray, it somehow works.

Now let's try to correct the script so that it runs through the entire file with the words and ends. To do this, in the properties of the
We are checking. File-> Save , Run-> Clear All , Run-> Start . We see that the cycle was executed 17 times, according to the number of lines in my file. Wonderful.
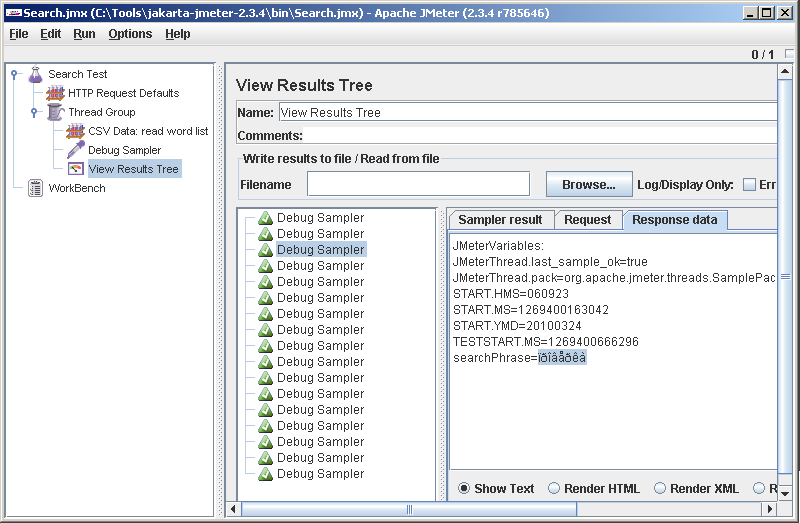
Somewhat overshadowed by the joy that JMeter displays the Cyrillic crooked. Looking ahead, I’ll say that he reads it really well and writes what he needs into the query, so you can put up with this jamb. In the old versions, he did not understand the Russian names of the elements, then they repaired them, and probably this one will be repaired with time.
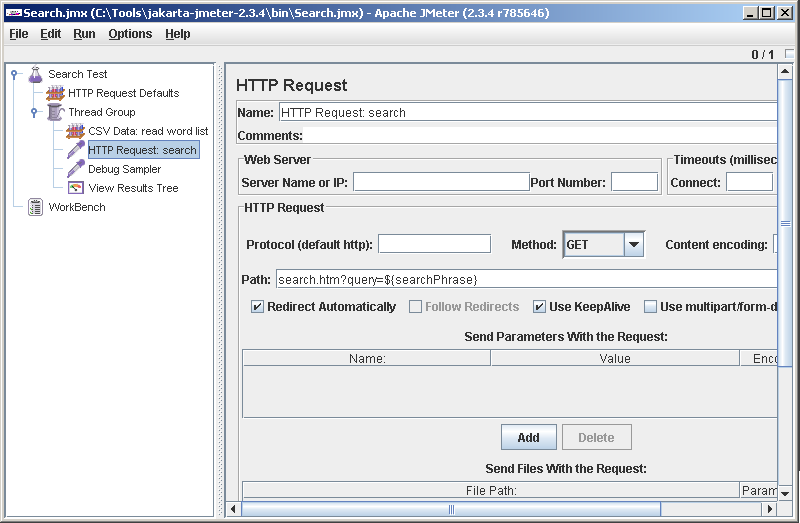
Add an HTTP request. Pay attention to the syntax as we refer to our variable, which read the phrase: $ {searchPhrase}. The Server Name or IP field is empty - the value is substituted from the HTTP Request Defaults . We will rename the request to HTTP Request: search (we will have several requests and confuse them incorrectly).
We try. Oops, mistake!

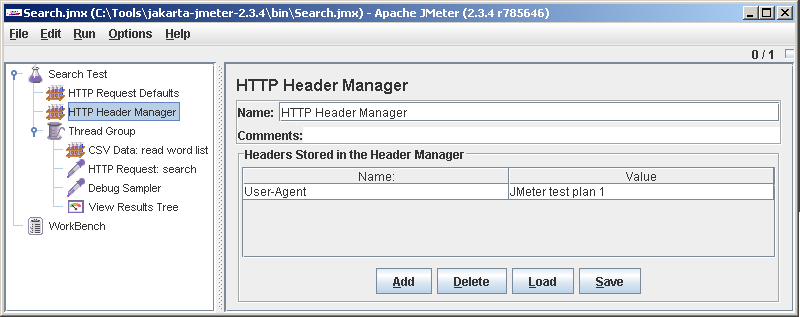
We're debugging, where do without errors. After reading carefully the server response, we recall that it needs the User-Agent header. Easy. Add another item under Search test: HTTP Header Manager. It can be seen that by default no headers are sent by JMeter. Click Add and add User-Agent.
We try. This time everything went smoothly. HTTP Request: search turned green in the results tree. Stepping on it, you can see the details: in the Sampler result tab - the server response headers, Request - URL and HTTP header, which we added, and in Response data - the response body.
Recall what we wanted, having received an answer, if it consists of several pages, select a random page, and from it take a link to the document. We go to parse respons and extract from it a link to the page. For HTTP Request: search, we say Add-> Post Processors-> Regular Expression Extractor . Let's start small: let's try to pull a specific link out of the page. From the server response just above, take a link to the page and paste it into the Regular Expression field. The return variable is called pageLink (sounds better than var1 or reResult).

based on the results of execution, we expect that we will get exactly the same <a href="/search.htm?query=test&nStart=20"> into the variable.
We try. \ File-> Save , Run-> Clear All , Run-> Start .

Uh ... Why pageLink = 0? Because regeksp not found. Why not found? Because the question mark must be escaped, that's why!Bevis, you are a cormorant
Then: <a href="/search.htm\?query=test&nStart=20">.
It is quite another matter. Now in the results:
We bring regexp to the mind:
We change Template for $ 1 $ - we will take away the first group. Select groups 2 and 3 - ([^ &] *), ([^ "] *) - not necessarily, it is possible without brackets. Just not everyone is as lucky as we are today, and often have to take not a ready URL, but design it is made of pieces, and here it is very convenient to use Template , for example, you can write
After execution we get:
Honestly, debugging regular expressions for JMeter is a separate song and sometimes takes a lot of time. The manual rightly advises for their debugging to make a separate test plan and load the page from a local file , so as not to torment the remote server and not lose time. Sometimes regexps in JMeter behave strangely, for example, an expression that works great in Notepad ++ may not find anything in JMeter. They write that the engine - Apach Jakarta ORO . It will be necessary to read on occasion.
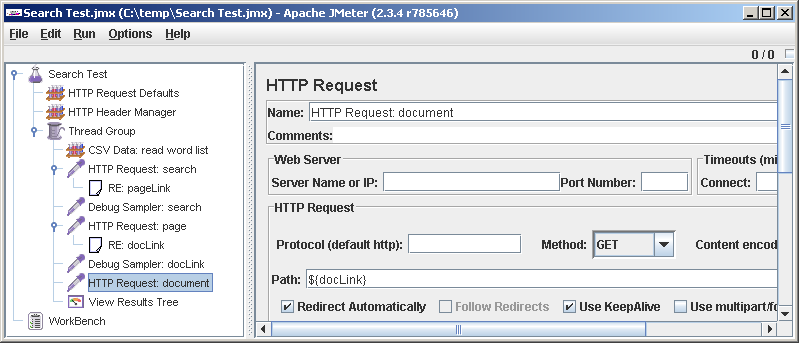
Add a second HTTP request to the test plan and parse its result. In the HTTP Request form, we leave everything by default, only in the Path field we write
Finally, add the last query - access to the found document. Since we are not going to parse its result, we don’t install the Debug Sampler after it, it will not show us anything new.
A little bit finalize the test plan. If we have only one page or nothing at all in the search results, JMeter will go to some unprecedented URL like
It turns out that. The response that the post processors work with (including Regular Expression Extractor ) is global for the thread. If the If Controller said no and the
In our file with the list of words we spoil the first word so that it is not exactly found. We try: it works.
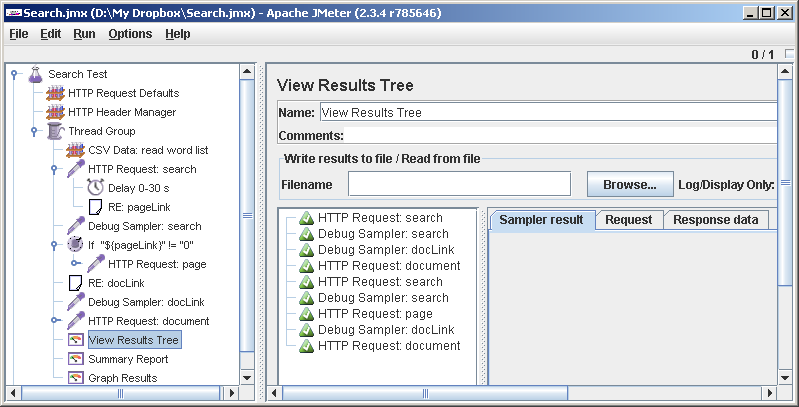
It is necessary to gradually round out. Around the last HTTP request, If Controller will not be diluted. As the final touches, after each request, we add a random delay in the amount of 0-30 s (for realism), and at the end of the test plan - the listeners Summary Report and Graph Results .

Well, we have debugged the execution logic. You can start testing, but this is a different conversation.
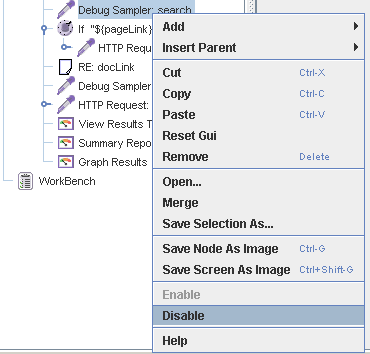
The only thing is: before starting to drive the test to the full extent, it is advisable to disable the debugging elements, including including the View Results Tree , because they pretty much slow down:
Just in case, let me remind you: before hammering a productive server, especially someone else's, it is worth thinking once again whether we are doing everything correctly. And then there are all sorts of cases.
Good luck!
PS
Environment:
Apache Jmeter 2.3.4
java full version "1.6.0_13-b03"
Windows vista home
PPS Here is a good article about debugging test plans, but asks for registration:
Tips for debugging your JMeter tests
We will test the search mechanism on the site. Let the script take a word or phrase from a file, ask a question to a search engine, get an answer in the form of one or several pages, randomly select one of the pages, just randomly select one of the links and follow it. Total three requests, except for special cases (when little is found or nothing is found).
Rushed.
Run the JMeter GUI and rename the proposed empty test plan (Test plan) to the Search test for the order (in general, today I will try to behave culturally and, in particular, to devote time to intelligible naming of script elements, this helps). Right-click on the Search test element in the tree on the left and, saying Add-> Config element-> HTTP Request Defaults , we’ll enter the server address there
')
I started HTTP Request Defaults to not enter the server address in each request. And when will it have to be changed? Avoid duplication. I was going to behave culturally, so I try.
Search Test-> Add-> Thread Group . Here we leave everything by default.
Thread Group-> Add-> Config Element-> CVS Data Set Config . With the help of this element we will read our words from the file, in each line on request.
By the way, we already have something to debug. The script does not go anywhere yet, but already reads something from a file and puts it into a variable (I called it searchPhrase). The sooner we start testing, the healthier we will be. Let's add items to debug.
Thread Group-> Add-> Sampler-> Debug Sampler .
Thread Group-> Add-> Listener-> View Results Tree . Here and there we leave all the default settings.
Save ( File-> Save ), run ( Run-> Clear All , Run-> Start ). We look in the View Results Tree and see that the script, as we wanted, was executed once. Click on the single result in the Results Tree ( Debug Sampler ) and go to the third tab Response data. In the last line we see: searchPhrase = test . Just in my first line of the file with the words test is written. Hooray, it somehow works.
Now let's try to correct the script so that it runs through the entire file with the words and ends. To do this, in the properties of the
Thread Group we set Loop Count: Forever , and for CSV Data: read word list Recycle on EOF? = False, Stop thread on EOF? = True.We are checking. File-> Save , Run-> Clear All , Run-> Start . We see that the cycle was executed 17 times, according to the number of lines in my file. Wonderful.
Somewhat overshadowed by the joy that JMeter displays the Cyrillic crooked. Looking ahead, I’ll say that he reads it really well and writes what he needs into the query, so you can put up with this jamb. In the old versions, he did not understand the Russian names of the elements, then they repaired them, and probably this one will be repaired with time.
Add an HTTP request. Pay attention to the syntax as we refer to our variable, which read the phrase: $ {searchPhrase}. The Server Name or IP field is empty - the value is substituted from the HTTP Request Defaults . We will rename the request to HTTP Request: search (we will have several requests and confuse them incorrectly).
We try. Oops, mistake!
We're debugging, where do without errors. After reading carefully the server response, we recall that it needs the User-Agent header. Easy. Add another item under Search test: HTTP Header Manager. It can be seen that by default no headers are sent by JMeter. Click Add and add User-Agent.
We try. This time everything went smoothly. HTTP Request: search turned green in the results tree. Stepping on it, you can see the details: in the Sampler result tab - the server response headers, Request - URL and HTTP header, which we added, and in Response data - the response body.
Recall what we wanted, having received an answer, if it consists of several pages, select a random page, and from it take a link to the document. We go to parse respons and extract from it a link to the page. For HTTP Request: search, we say Add-> Post Processors-> Regular Expression Extractor . Let's start small: let's try to pull a specific link out of the page. From the server response just above, take a link to the page and paste it into the Regular Expression field. The return variable is called pageLink (sounds better than var1 or reResult).
based on the results of execution, we expect that we will get exactly the same <a href="/search.htm?query=test&nStart=20"> into the variable.
We try. \ File-> Save , Run-> Clear All , Run-> Start .
Uh ... Why pageLink = 0? Because regeksp not found. Why not found? Because the question mark must be escaped, that's why!
Then: <a href="/search.htm\?query=test&nStart=20">.
It is quite another matter. Now in the results:
pageLink=<a href="/search.htm?query=test&nStart=20">
pageLink_g=0
pageLink_g0=<a href="/search.htm?query=test&nStart=20">
searchPhrase=test
We bring regexp to the mind:
<a href="/(search.htm\?query=([^&]*)&nStart=([^"]*))"> .We change Template for $ 1 $ - we will take away the first group. Select groups 2 and 3 - ([^ &] *), ([^ "] *) - not necessarily, it is possible without brackets. Just not everyone is as lucky as we are today, and often have to take not a ready URL, but design it is made of pieces, and here it is very convenient to use Template , for example, you can write
find.pl?text=$1$&start=$2$ . As a result, in the pageLink variable we will have a compiled URL.After execution we get:
pageLink=<a href="/search.htm?query=test&nStart=20">
pageLink_g=3
pageLink_g0=<a href="/search.htm?query=test&nStart=20">
pageLink_g1=search.htm?query=test&nStart=20
pageLink_g2=test
pageLink_g3=20
searchPhrase=test
Honestly, debugging regular expressions for JMeter is a separate song and sometimes takes a lot of time. The manual rightly advises for their debugging to make a separate test plan and load the page from a local file , so as not to torment the remote server and not lose time. Sometimes regexps in JMeter behave strangely, for example, an expression that works great in Notepad ++ may not find anything in JMeter. They write that the engine - Apach Jakarta ORO . It will be necessary to read on occasion.
Add a second HTTP request to the test plan and parse its result. In the HTTP Request form, we leave everything by default, only in the Path field we write
${pageLink} . We agreed to go to the document from the second search page. Regeksp, respectively, will be different: <p class="r"> <a href="([^"]+)"> . After the request and Regular Expression Extractor we add Debug Samlper. Of course, we give all the elements unique and meaningful names. Debugging.Finally, add the last query - access to the found document. Since we are not going to parse its result, we don’t install the Debug Sampler after it, it will not show us anything new.
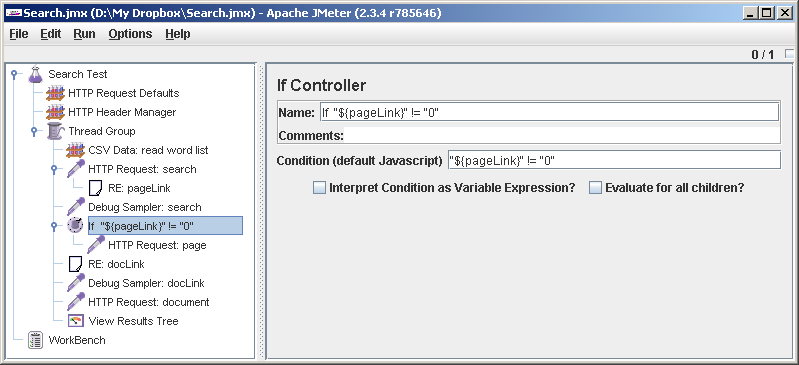
A little bit finalize the test plan. If we have only one page or nothing at all in the search results, JMeter will go to some unprecedented URL like
http://0 , and may be offended by us. To prevent this from happening, add a check. Thread Group-> Add-> Logic Controller-> If Controller . In the Condition field we write "${pageLink}" != "0" . For clarity, rename the controller (clarity is not superfluous). Now drag it, set after Debug Sampler: page . Dragging HTTP Request: page under If Controller. Now attention: we take out RE: docLink from under HTTP Request: page and we put it after If Controller.It turns out that. The response that the post processors work with (including Regular Expression Extractor ) is global for the thread. If the If Controller said no and the
HTTP Request: page failed, RE: docLink will RE: docLink response left after the first HTTP request. What I used to do Regular Expression Extractor as a descendant of HTTP Request doesn’t make much sense, it’s just that it goes later (but it seems to me that the plan looks clearer if the post-processor is a descendant of the sampler).In our file with the list of words we spoil the first word so that it is not exactly found. We try: it works.
HTTP Request: page View HTTP Request: page did not appear in View Results Tree , and HTTP Request: document gave an error. Well, maybe not the first time it works. Even most likely not from the first. For example, I first wrote ${pageLink} != "0" , and this condition always gave False, but with quotes everything worked as it should.It is necessary to gradually round out. Around the last HTTP request, If Controller will not be diluted. As the final touches, after each request, we add a random delay in the amount of 0-30 s (for realism), and at the end of the test plan - the listeners Summary Report and Graph Results .
Well, we have debugged the execution logic. You can start testing, but this is a different conversation.
The only thing is: before starting to drive the test to the full extent, it is advisable to disable the debugging elements, including including the View Results Tree , because they pretty much slow down:
Just in case, let me remind you: before hammering a productive server, especially someone else's, it is worth thinking once again whether we are doing everything correctly. And then there are all sorts of cases.
Good luck!
PS
Environment:
Apache Jmeter 2.3.4
java full version "1.6.0_13-b03"
Windows vista home
PPS Here is a good article about debugging test plans, but asks for registration:
Tips for debugging your JMeter tests
Source: https://habr.com/ru/post/88714/
All Articles