Gantt vs backlog
Good day!
I want to tell you about an interesting result of the brainstorming that we conducted last week.
The interesting point is that we have rethought the possibilities of Gantt diagrams for working with Agile projects. Before the storm, my colleagues and I thought of this diagram as one of the many ways to display a project plan and its progress. In this approximation, we have a task list, a developer list, a calendar, and an array of progress reports from the team that we can show in different views — Gantt, PERT, and Backlog.
')
It turned out that we were wrong. In addition to the “local” negative result, we received quite important generalizations at the level of ideology and philosophy of managing Agile projects.
Prehistory
We develop an online tool for working with project plans in different display modes. We started with determinative processes and implemented the Gantt and PERT charts with a critical path. Now we are connecting empirical processes, such as Scrum. The general ideology that we offer to service users is the integration of both types of processes.
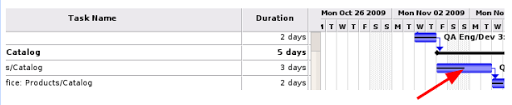
So, we have a common determinant project plan, modeled using the Gantt diagram. Now we start the Scrum iteration. We need to cut a range of tasks from this Gantt, which is included in the iteration, and be able to switch the view between the Gantt and Backlog charts. The first model that we started to implement was conceived simply: on the iteration plan page there are two corresponding tabs; switching between them, the user sees either the Gantt or the Backlog iteration. At the same time, reporting on tasks is structured as follows: the user periodically (from two to eight times a day) writes short messages to the system, or tweets consisting of two fields. The first field is a classic tweet - a short text describing the implementation status and the second is a number corresponding to the time left until the task is completed in hours. When switching between the “Gantt” and “Backlog” tabs, this data should either fall into the “cells” of the Backlog:
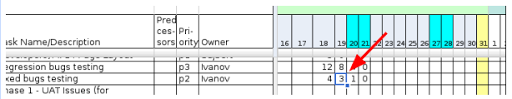
or recalculated in the progress of the task on Gantt:
It all started when the programmer (Volodya), who implemented this functionality, sent out a message that he had serious logical contradictions during implementation. We gathered near the blackboard with flamasters and started brainstorming.
Problem
Volodya described 2 contradictions with which he encountered:
1. If a task is suspended on a task, Gantt demonstrates gradual “phantom” progress on the task. Moreover, the longer the simple one, the more progress is shown;
2. It is impossible to show the movement of resources. The distribution of people by tasks in Skram is very dynamic and this becomes a problem for Gantt.
Let's dig into the problem. Iteration has the properties of a small independent project. If the manager drew Gantt for this iteration, then we must stick to his schedule in order to be tied to what was planned. We do not need to constantly update durations or dependencies between tasks. Progress for developers should be shown inside a rigid structure of unchanged tasks and their dependencies.
In this scheme, we calculate the progress of the task on Gantt using the following formula: progress% = 100 * hours_spent / (hours_spent + hours_left), where progress% is progress as a percentage, hours_spent is the number of hours spent and the last_left is the last estimate of the remaining hours. This formula works until we go beyond the planned task duration. Imagine a speculative example: nothing has been done on the task, it takes 8 hours to implement it, we forgot about this task and returned to it a month later. Progress will be equal to 100 * 20 * 8 / (20 * 8 + 8) = 95%! When not started work!
During the brainstorming, several ideas for modifying the formula were received, but all of them were quickly excluded. At some point, we decided to dynamically move the task around the calendar and change its duration. However, this direction was also a dead end. What is the percentage of the task, the duration of which is constantly changing? Plus, dependencies between tasks quickly bring the entire structure of tasks beyond the length of the iteration.
Moving people between tasks on Gantt also requires a radical redesign of the task structure and connections. The result - during the sprint Gantt quickly loses relevance.
Not finding a technical solution to the problem, we moved to a higher level - to abstraction.
Abstraction
It has long been noted, and it seems, expressed by Einstein that "a serious problem can not be solved at the same level at which it arose." We temporarily threw out the details and began to look for fundamental differences between Gantt and Backlog. And they found ...
It was formulated several slogans (laconic and capacious ideas), which determined the further course of the assault:
- Gantt is a static diagram, and Backlog is a dynamic one.
- Backlog is projected into a sequence of gantt diagrams - not at all on one diagram.
- Each day in the Backlog corresponds to a separate Gantt chart.
Some details were added after comparing the degrees of freedom of these two diagrams ...
Degrees of freedom Backlog:
- duration of tasks
- task performers
- number of tasks in the iteration
Gantt degree of freedom:
- the progress of the task
Finally, we were able to formulate a solution to the problem that “hooked” not only the plan page, but also the ideology of the entire application ...
Decision
Gantt is not applicable to the Agile (or empirical) iteration plan. This is the coverage area of a Backlog or similar dynamic diagrams. The boundary of the determinant and empirical process lies between the level of the overall plan of the project and its phases, on the one hand, and the level of iteration, on the other.
In our application (for the time being) there are no described levels, we work with separate plans as with documents. When we create a new plan, we ask the user what process he is going with - with the determinant or empirical one. Having made this choice, the user uniquely determines the approach to project visualization. On the plan page, the user sees the Gantt and PERT tabs in the deterministic approach, and Backlog and Burndown in the empirical approach.
Bright thoughts to you!
I want to tell you about an interesting result of the brainstorming that we conducted last week.
The interesting point is that we have rethought the possibilities of Gantt diagrams for working with Agile projects. Before the storm, my colleagues and I thought of this diagram as one of the many ways to display a project plan and its progress. In this approximation, we have a task list, a developer list, a calendar, and an array of progress reports from the team that we can show in different views — Gantt, PERT, and Backlog.
')
It turned out that we were wrong. In addition to the “local” negative result, we received quite important generalizations at the level of ideology and philosophy of managing Agile projects.
Prehistory
We develop an online tool for working with project plans in different display modes. We started with determinative processes and implemented the Gantt and PERT charts with a critical path. Now we are connecting empirical processes, such as Scrum. The general ideology that we offer to service users is the integration of both types of processes.
So, we have a common determinant project plan, modeled using the Gantt diagram. Now we start the Scrum iteration. We need to cut a range of tasks from this Gantt, which is included in the iteration, and be able to switch the view between the Gantt and Backlog charts. The first model that we started to implement was conceived simply: on the iteration plan page there are two corresponding tabs; switching between them, the user sees either the Gantt or the Backlog iteration. At the same time, reporting on tasks is structured as follows: the user periodically (from two to eight times a day) writes short messages to the system, or tweets consisting of two fields. The first field is a classic tweet - a short text describing the implementation status and the second is a number corresponding to the time left until the task is completed in hours. When switching between the “Gantt” and “Backlog” tabs, this data should either fall into the “cells” of the Backlog:
or recalculated in the progress of the task on Gantt:
It all started when the programmer (Volodya), who implemented this functionality, sent out a message that he had serious logical contradictions during implementation. We gathered near the blackboard with flamasters and started brainstorming.
Problem
Volodya described 2 contradictions with which he encountered:
1. If a task is suspended on a task, Gantt demonstrates gradual “phantom” progress on the task. Moreover, the longer the simple one, the more progress is shown;
2. It is impossible to show the movement of resources. The distribution of people by tasks in Skram is very dynamic and this becomes a problem for Gantt.
Let's dig into the problem. Iteration has the properties of a small independent project. If the manager drew Gantt for this iteration, then we must stick to his schedule in order to be tied to what was planned. We do not need to constantly update durations or dependencies between tasks. Progress for developers should be shown inside a rigid structure of unchanged tasks and their dependencies.
In this scheme, we calculate the progress of the task on Gantt using the following formula: progress% = 100 * hours_spent / (hours_spent + hours_left), where progress% is progress as a percentage, hours_spent is the number of hours spent and the last_left is the last estimate of the remaining hours. This formula works until we go beyond the planned task duration. Imagine a speculative example: nothing has been done on the task, it takes 8 hours to implement it, we forgot about this task and returned to it a month later. Progress will be equal to 100 * 20 * 8 / (20 * 8 + 8) = 95%! When not started work!
During the brainstorming, several ideas for modifying the formula were received, but all of them were quickly excluded. At some point, we decided to dynamically move the task around the calendar and change its duration. However, this direction was also a dead end. What is the percentage of the task, the duration of which is constantly changing? Plus, dependencies between tasks quickly bring the entire structure of tasks beyond the length of the iteration.
Moving people between tasks on Gantt also requires a radical redesign of the task structure and connections. The result - during the sprint Gantt quickly loses relevance.
Not finding a technical solution to the problem, we moved to a higher level - to abstraction.
Abstraction
It has long been noted, and it seems, expressed by Einstein that "a serious problem can not be solved at the same level at which it arose." We temporarily threw out the details and began to look for fundamental differences between Gantt and Backlog. And they found ...
It was formulated several slogans (laconic and capacious ideas), which determined the further course of the assault:
- Gantt is a static diagram, and Backlog is a dynamic one.
- Backlog is projected into a sequence of gantt diagrams - not at all on one diagram.
- Each day in the Backlog corresponds to a separate Gantt chart.
Some details were added after comparing the degrees of freedom of these two diagrams ...
Degrees of freedom Backlog:
- duration of tasks
- task performers
- number of tasks in the iteration
Gantt degree of freedom:
- the progress of the task
Finally, we were able to formulate a solution to the problem that “hooked” not only the plan page, but also the ideology of the entire application ...
Decision
Gantt is not applicable to the Agile (or empirical) iteration plan. This is the coverage area of a Backlog or similar dynamic diagrams. The boundary of the determinant and empirical process lies between the level of the overall plan of the project and its phases, on the one hand, and the level of iteration, on the other.
In our application (for the time being) there are no described levels, we work with separate plans as with documents. When we create a new plan, we ask the user what process he is going with - with the determinant or empirical one. Having made this choice, the user uniquely determines the approach to project visualization. On the plan page, the user sees the Gantt and PERT tabs in the deterministic approach, and Backlog and Burndown in the empirical approach.
Bright thoughts to you!
Source: https://habr.com/ru/post/88373/
All Articles