📜 ⬆️ ⬇️

Bluff - a library for drawing charts in canvas

Recently, a friend gave a link to a very good javascript library for drawing a variety of graphs in a canvas. It is called Bluff . Below is a little about her.

How to use


All graphs have approximately the same initialization method:
// , id
var g = new Bluff.Line('example', 400);

//
g.theme_keynote();
g.title = 'My Graph';
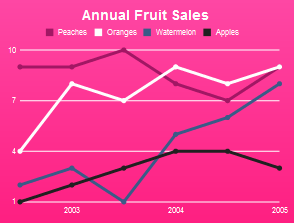
//
g.data('Apples', [1, 2, 3, 4, 4, 3]);
g.data('Oranges', [4, 8, 7, 9, 8, 9]);
g.data('Watermelon', [2, 3, 1, 5, 6, 8]);
g.data('Peaches', [9, 9, 10, 8, 7, 9]);
g.labels = {0: '2003', 2: '2004', 4: '2005'};

//
g.draw();


By default, the aspect ratio is 4: 3. But the height can also be set manually:

var g = new Bluff.Line('example', '800x300');

The current version of the library supports the following types of graphs:

')

HTML data


Above was considered the method of data transmission through an array, but Bluff also allows you to insert data from HTML tables. The main thing is to make sure that the tag . ,

Annual Fruit Sales Apples Oranges Watermelon Peaches 1 4 2 9 2003 2 8 3 9 3 7 1 10 2004 4 9 5 8 4 8 6 7 2005 3 9 8 9
image
< table id ="data" >
< caption > Annual Fruit Sales </ caption >
< thead >
< tr >
< th scope ="col" ></ th >
< th scope ="col" > Apples </ th >
< th scope ="col" > Oranges </ th >
< th scope ="col" > Watermelon </ th >
< th scope ="col" > Peaches </ th >
</ tr >
</ thead >
< tbody >
< tr >
< th scope ="row" ></ th >
< td > 1 </ td > < td > 4 </ td > < td > 2 </ td > < td > 9 </ td >
</ tr >
< tr >
< th scope ="row" > 2003 </ th >
< td > 2 </ td > < td > 8 </ td > < td > 3 </ td > < td > 9 </ td >
</ tr >
< tr >
< th scope ="row" ></ th >
< td > 3 </ td > < td > 7 </ td > < td > 1 </ td > < td > 10 </ td >
</ tr >
< tr >
< th scope ="row" > 2004 </ th >
< td > 4 </ td > < td > 9 </ td > < td > 5 </ td > < td > 8 </ td >
</ tr >
< tr >
< th scope ="row" ></ th >
< td > 4 </ td > < td > 8 </ td > < td > 6 </ td > < td > 7 </ td >
</ tr >
< tr >
< th scope ="row" > 2005 </ th >
< td > 3 </ td > < td > 9 </ td > < td > 8 </ td > < td > 9 </ td >
</ tr >
</ tbody >
</ table >
< canvas id ="graph" width ="300" height ="225" ></ canvas >
< script type ="text/javascript" >
var g = new Bluff.Line( 'graph' , '300x225' );
g.theme_odeo();
g.data_from_table( 'data' );
g.draw();
</ script >

* This source code was highlighted with Source Code Highlighter .


. . , . , colors, marker_color, font_color morebackground_colors:

g.set_theme({
colors: ['#202020', 'white', '#a21764', '#8ab438',
'#999999', '#3a5b87', 'black'],
marker_color: '#aea9a9',
font_color: 'black',
background_colors: ['#ff47a4', '#ff1f81']
});


:
g.theme_keynote();
g.theme_37signals();
g.theme_rails_keynote();
g.theme_odeo();
g.theme_pastel();
g.theme_greyscale();


. css, :
< div class ="bluff-tooltip" >
< span class ="label" >
< span style ="color: #abcdef;" > </ span >
Data series name
</ span >
< span class ="data" >
42
</ span >
</ div >


* This source code was highlighted with Source Code Highlighter .


g.tooltips = true , . :
Bluff.AccumulatorBar Bluff.Bar Bluff.Line Bluff.Mini.Bar Bluff.Mini.SideBar Bluff.SideBar Bluff.SideStackedBar Bluff.StackedBar
.
. ,

Annual Fruit Sales Apples Oranges Watermelon Peaches 1 4 2 9 2003 2 8 3 9 3 7 1 10 2004 4 9 5 8 4 8 6 7 2005 3 9 8 9
image
< table id ="data" >
< caption > Annual Fruit Sales </ caption >
< thead >
< tr >
< th scope ="col" ></ th >
< th scope ="col" > Apples </ th >
< th scope ="col" > Oranges </ th >
< th scope ="col" > Watermelon </ th >
< th scope ="col" > Peaches </ th >
</ tr >
</ thead >
< tbody >
< tr >
< th scope ="row" ></ th >
< td > 1 </ td > < td > 4 </ td > < td > 2 </ td > < td > 9 </ td >
</ tr >
< tr >
< th scope ="row" > 2003 </ th >
< td > 2 </ td > < td > 8 </ td > < td > 3 </ td > < td > 9 </ td >
</ tr >
< tr >
< th scope ="row" ></ th >
< td > 3 </ td > < td > 7 </ td > < td > 1 </ td > < td > 10 </ td >
</ tr >
< tr >
< th scope ="row" > 2004 </ th >
< td > 4 </ td > < td > 9 </ td > < td > 5 </ td > < td > 8 </ td >
</ tr >
< tr >
< th scope ="row" ></ th >
< td > 4 </ td > < td > 8 </ td > < td > 6 </ td > < td > 7 </ td >
</ tr >
< tr >
< th scope ="row" > 2005 </ th >
< td > 3 </ td > < td > 9 </ td > < td > 8 </ td > < td > 9 </ td >
</ tr >
</ tbody >
</ table >
< canvas id ="graph" width ="300" height ="225" ></ canvas >
< script type ="text/javascript" >
var g = new Bluff.Line( 'graph' , '300x225' );
g.theme_odeo();
g.data_from_table( 'data' );
g.draw();
</ script >

* This source code was highlighted with Source Code Highlighter .


. . , . , colors, marker_color, font_color morebackground_colors:

g.set_theme({
colors: ['#202020', 'white', '#a21764', '#8ab438',
'#999999', '#3a5b87', 'black'],
marker_color: '#aea9a9',
font_color: 'black',
background_colors: ['#ff47a4', '#ff1f81']
});


:
g.theme_keynote();
g.theme_37signals();
g.theme_rails_keynote();
g.theme_odeo();
g.theme_pastel();
g.theme_greyscale();


. css, :
< div class ="bluff-tooltip" >
< span class ="label" >
< span style ="color: #abcdef;" > </ span >
Data series name
</ span >
< span class ="data" >
42
</ span >
</ div >


* This source code was highlighted with Source Code Highlighter .


g.tooltips = true , . :
Bluff.AccumulatorBar Bluff.Bar Bluff.Line Bluff.Mini.Bar Bluff.Mini.SideBar Bluff.SideBar Bluff.SideStackedBar Bluff.StackedBar
.
. ,

Annual Fruit Sales Apples Oranges Watermelon Peaches 1 4 2 9 2003 2 8 3 9 3 7 1 10 2004 4 9 5 8 4 8 6 7 2005 3 9 8 9
image
< table id ="data" >
< caption > Annual Fruit Sales </ caption >
< thead >
< tr >
< th scope ="col" ></ th >
< th scope ="col" > Apples </ th >
< th scope ="col" > Oranges </ th >
< th scope ="col" > Watermelon </ th >
< th scope ="col" > Peaches </ th >
</ tr >
</ thead >
< tbody >
< tr >
< th scope ="row" ></ th >
< td > 1 </ td > < td > 4 </ td > < td > 2 </ td > < td > 9 </ td >
</ tr >
< tr >
< th scope ="row" > 2003 </ th >
< td > 2 </ td > < td > 8 </ td > < td > 3 </ td > < td > 9 </ td >
</ tr >
< tr >
< th scope ="row" ></ th >
< td > 3 </ td > < td > 7 </ td > < td > 1 </ td > < td > 10 </ td >
</ tr >
< tr >
< th scope ="row" > 2004 </ th >
< td > 4 </ td > < td > 9 </ td > < td > 5 </ td > < td > 8 </ td >
</ tr >
< tr >
< th scope ="row" ></ th >
< td > 4 </ td > < td > 8 </ td > < td > 6 </ td > < td > 7 </ td >
</ tr >
< tr >
< th scope ="row" > 2005 </ th >
< td > 3 </ td > < td > 9 </ td > < td > 8 </ td > < td > 9 </ td >
</ tr >
</ tbody >
</ table >
< canvas id ="graph" width ="300" height ="225" ></ canvas >
< script type ="text/javascript" >
var g = new Bluff.Line( 'graph' , '300x225' );
g.theme_odeo();
g.data_from_table( 'data' );
g.draw();
</ script >

* This source code was highlighted with Source Code Highlighter .


. . , . , colors, marker_color, font_color morebackground_colors:

g.set_theme({
colors: ['#202020', 'white', '#a21764', '#8ab438',
'#999999', '#3a5b87', 'black'],
marker_color: '#aea9a9',
font_color: 'black',
background_colors: ['#ff47a4', '#ff1f81']
});


:
g.theme_keynote();
g.theme_37signals();
g.theme_rails_keynote();
g.theme_odeo();
g.theme_pastel();
g.theme_greyscale();


. css, :
< div class ="bluff-tooltip" >
< span class ="label" >
< span style ="color: #abcdef;" > </ span >
Data series name
</ span >
< span class ="data" >
42
</ span >
</ div >


* This source code was highlighted with Source Code Highlighter .


g.tooltips = true , . :
Bluff.AccumulatorBar Bluff.Bar Bluff.Line Bluff.Mini.Bar Bluff.Mini.SideBar Bluff.SideBar Bluff.SideStackedBar Bluff.StackedBar
.

Source: https://habr.com/ru/post/88294/


All Articles