About Habrahabr, statistics and ... tag clouds
Hello!
About a month ago I wrote an article in which I submitted several graphs to the court of a respected community. Graphs as they could reflect the history of the development of this site and tried to assess the quality of the content on it. I don’t even know if they managed to achieve their goal, but on the whole the article was quite warmly received. Even then, I promised myself that if possible, I would try to continue the topic.
Last time I tried to reflect the thematic content of Habrakhabr with the help of graphics and pie charts that operated on the number of articles belonging to one or another category of blogs . And, if it's fair, I think that I managed it very badly.
I thought that there must be some ways to reflect the thematic content of the site in time. Unfortunately, googling did not produce results - mankind has not yet come up with anything better than the good old graphs. But wait! After all, we live in the era of Web 2.0 and one of its main characters is the usual tag cloud. You have all seen it many times, it is banal to the impossibility and has already managed to get bored with its presence on every second site, and also in various 3d flash flash forms. But, in fairness, the tag cloud gained its popularity precisely because it very well reflects the thematic content of the site. But what if you try to draw a tag cloud and make it dynamically changeable over time? Such a tag time machine. Then it remained for the small: think about how it will look, make it more dynamic, highlight the evening for the implementation conceived at WPF and another evening for rendering and encoding in the video. What I did was called “Tag Tornado” or “Tornado Tag”. You can see the hero of the occasion in the following video:
* I recommend watching the video on the YouTube website in the “big” player and 480p resolution
** never managed to pick up music for the video, I leave her choice to the viewer. Sit back, sit back and enjoy
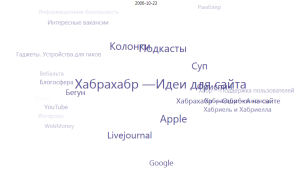
It's very simple it works - blog names revolve around a common center in a circle with a constant angular velocity. For each successive moment (in this case, in two-hour increments), the “weight” of each blog is calculated. The weight of a blog depends on the total evaluation of articles in it over a period of about two weeks, and the rating of each article is multiplied by the coefficient of removal from the moment of its publication from the moment we are considering. In general, the closer the article was to this point, the more its assessment affects the weight. After calculating the weights of all blogs for a given moment, they are normalized and fit into the interval [0; 1] by dividing by the maximum score. Those blogs whose maximum weight never exceeded 0.1 in general are thrown away.
Weight affects three parameters - the larger it is, the smaller the distance of the tag from the center, the larger the font size and the less transparency of the text. Tags are lexicographically sorted. To all this, several additional coefficients have been added, which ensure the overall smoothness of the departures and tag flights to the “stage”.
The attentiveand boring reader will notice that not the tags, but the Habrakhabra blogs are spinning on the video, but I have already prepared the answer: the fact is that there are too many tags and they are too different, therefore such visualization is not the same as the synonym tables and semantic links between the tags would not be very useful - too much important information would be lost. Visualizing the same categories as in the previous article does not make sense, because there are too few of them.
Also, tags sometimes crawl over each other, but if you look at the dynamics, rather than individual frames, it almost does not interfere with readability.
And yes, as far as the name of the visualization is concerned, at first I wanted to call it a “whirlpool”, but as a result I came to the conclusion that the “atmospheric” analogy with the tag cloud would be better.
Thanks for attention.
About a month ago I wrote an article in which I submitted several graphs to the court of a respected community. Graphs as they could reflect the history of the development of this site and tried to assess the quality of the content on it. I don’t even know if they managed to achieve their goal, but on the whole the article was quite warmly received. Even then, I promised myself that if possible, I would try to continue the topic.
And again about thematic content
Last time I tried to reflect the thematic content of Habrakhabr with the help of graphics and pie charts that operated on the number of articles belonging to one or another category of blogs . And, if it's fair, I think that I managed it very badly.
I thought that there must be some ways to reflect the thematic content of the site in time. Unfortunately, googling did not produce results - mankind has not yet come up with anything better than the good old graphs. But wait! After all, we live in the era of Web 2.0 and one of its main characters is the usual tag cloud. You have all seen it many times, it is banal to the impossibility and has already managed to get bored with its presence on every second site, and also in various 3d flash flash forms. But, in fairness, the tag cloud gained its popularity precisely because it very well reflects the thematic content of the site. But what if you try to draw a tag cloud and make it dynamically changeable over time? Such a tag time machine. Then it remained for the small: think about how it will look, make it more dynamic, highlight the evening for the implementation conceived at WPF and another evening for rendering and encoding in the video. What I did was called “Tag Tornado” or “Tornado Tag”. You can see the hero of the occasion in the following video:
* I recommend watching the video on the YouTube website in the “big” player and 480p resolution
** never managed to pick up music for the video, I leave her choice to the viewer. Sit back, sit back and enjoy
How it works?
It's very simple it works - blog names revolve around a common center in a circle with a constant angular velocity. For each successive moment (in this case, in two-hour increments), the “weight” of each blog is calculated. The weight of a blog depends on the total evaluation of articles in it over a period of about two weeks, and the rating of each article is multiplied by the coefficient of removal from the moment of its publication from the moment we are considering. In general, the closer the article was to this point, the more its assessment affects the weight. After calculating the weights of all blogs for a given moment, they are normalized and fit into the interval [0; 1] by dividing by the maximum score. Those blogs whose maximum weight never exceeded 0.1 in general are thrown away.
Weight affects three parameters - the larger it is, the smaller the distance of the tag from the center, the larger the font size and the less transparency of the text. Tags are lexicographically sorted. To all this, several additional coefficients have been added, which ensure the overall smoothness of the departures and tag flights to the “stage”.
Instead of conclusion
The attentive
Also, tags sometimes crawl over each other, but if you look at the dynamics, rather than individual frames, it almost does not interfere with readability.
And yes, as far as the name of the visualization is concerned, at first I wanted to call it a “whirlpool”, but as a result I came to the conclusion that the “atmospheric” analogy with the tag cloud would be better.
Thanks for attention.
')
Source: https://habr.com/ru/post/84251/
All Articles