Simple load test with Apache JMeter
According to my observations, developers rarely do load testing sites and web applications. And it so happens that they put the project on the Internet, and then suddenly the visitors start walking (habraeffekt, for example, happened), and the site at the most opportune moment lays down or begins to slow down, not childishly.
Why not avoid these troubles by driving a stress test?
Probably, someone stops the misconception that load testing is a very difficult matter that requires special knowledge. However, not the gods burn pots. If the choice is to test not too professionally, or not to test at all, I would choose the first one. Moreover, it is very easy to organize a primitive performance test. You can use online tools (see, for example, Load Testing in a quick way ), or you can do it yourself, it is not much more difficult.
')
Under the cut, I tell you how to organize a simple site load test from scratch using Apache JMeter .
I just want to warn you that the described approach (Log Replay) works well for sites, and is not suitable for web applications that actively use POST, and also, by its simplicity, ignores the existence of cookie-based sessions. In addition, it is undesirable to test a project deployed at 127.0.0.1, the results are quite distorted because JMeter and the site slow down each other (on the other hand, it’s bad when the server is far away - delays are interfering).
We will need:
There is also a good way to generate a file, which for JMeter will come off the log, and without going into the server's file system. We get somewhere from the list of site URLs. An acceptable list makes Xenu in the scan report. Paste this list into a text file. It will turn out something like
We make a global replay "http: //test.local" on "" GET "(with quotes and spaces), we get
This parser format eats well, taking it at face value (you do not need to close the quotation marks at the end of the line).
So, download JMeter ( http://jakarta.apache.org/site/downloads/downloads_jmeter.cgi , expand the archive, go to the bin directory and run jmeter.bat (do an example under Windows). After a short pause, the GUI of a traditional toad will start .
On the left we observe a tree of 2 nodes: TestPlan and Workbench (we forget about the second one immediately, we will not need it). On Test Plan, right click and say Add-> Thread Group (in the interface you can see a lot of chips of different degrees of utility, but we are not distracted now, but go to our test in the shortest way, then we will explore the extensive capabilities of JMeter in more detail) .

Thread group added:
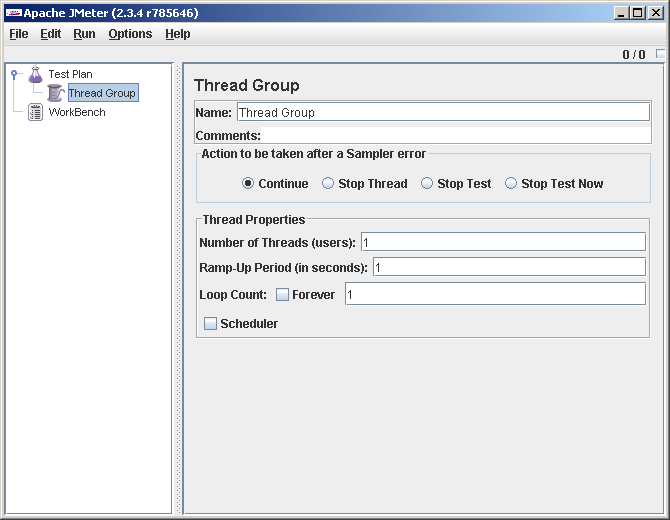
We will not change anything here. The numbers all cost 1 each, which is good. This is a single virtual user, once or twice running the script (in the case of the Access Log Sampler we use, it will execute one request that corresponds to the first line of the log). And we do not need more to debug the test.
We will not rename the Test Plan and Thread Group either; these names are unique within the test.
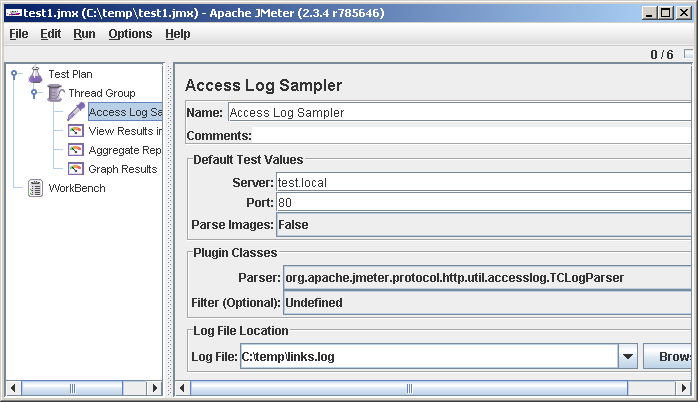
Right click on the Thread Group add Access Log Sampler (Thread Group-> Add-> Sampler-> Access Log Sampler)

We drive in the server address and local path to the access log (we dragged it from the server and put it on our disk):
Now add to the test viewer:
The test plan is ready, we proceed to testing it :) and debugging (nothing, nothing, it can make money the first time).
File-> Save , and so every time after making changes to the test plan. This is important, the JMeter hangs another time, and the test has to be restored from memory.
Run-> Clear All (the first time you can not do, but then you still need).
Run-> Start .
And we go to look at the View Results in Table . If we are lucky, there will be one line, with a green tick in the Status column.

If something went wrong, the status will be an error:

If this is the case, go read our TestPlan.log. As a rule, according to reports it can be guessed exactly what has broken. For example, if the server being tested does not respond, the following is displayed in the log:
We set, figured out, or all at once went clean. Go to the properties of the Thread Group and set the Loop Count: Forever
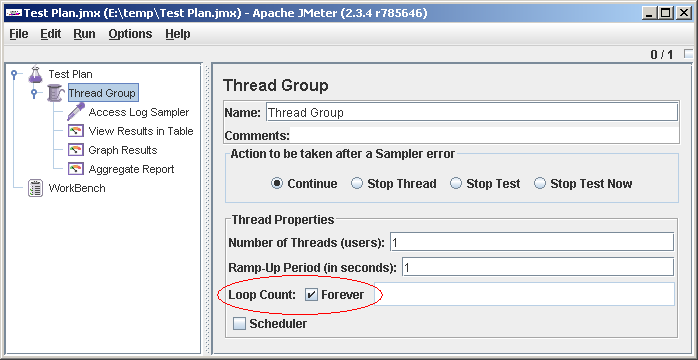
Run (File-> Save, Run-> Clear All, Run-> Start). We go to look in View Results in Table . It should turn out like this:

In the last line of the error, this JMeter is experiencing a breakdown because the file has ended (apparently, used to work with infinite files). Unfortunately, at the end of the file, the script stops, ignoring the setting of Action to be taken after a Sampler error = Continue (this seems to me a bug, and the developers must have features). To prevent this from distorting the test results, it is better to take long enough access logs. It is easy to organize a long file from a short file using copy in the command line or Ctrl + C, Ctrl + V in a text editor. For our experiments, more than 1000 lines in the log are hardly needed.
Still, before starting the test, add a random delay ( Uniform Random Timer ) of 0-1000 milliseconds to the beginning of the script, it usually helps to smooth out some graphs. As a result, the script works like this: waits for a random number of milliseconds, reads a line from the log, makes an HTTP request, sends the results to the listeners, waits again, reads the next line, and so on.
We do the first sighting test. In the properties of the thread group, we put: Number of Threads (users): 100, Ramp-Up Period (in seconds) : 100. We are going to set 100 virtual users on the site, putting them into battle one by one within 100 seconds, that is, by user per second. I took the numbers 100 and 100 from somewhere from the ceiling, but you have to start somewhere.
Once again, we remind ourselves that we have good chances to slow down or even fill up the site (which may not be good if we are talking about a project that is already running). OK, being sane and sober, realizing responsibility for our actions, we begin.
File-> Save, Run-> Clear All, Run-> Start and go to watch Graph Results. We see, say, such a picture:
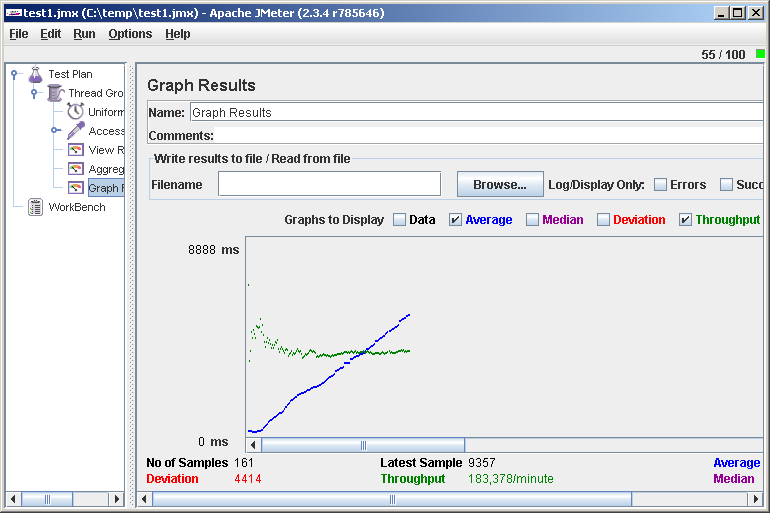
In the upper right corner you can see the current number of virtual users.
What does this chart tell us? The average response time ( Average ) increases, and the processing speed ( Throughput ) does not change. This means that somewhere on the server operations are queued, and there is not enough performance to service all requests. Having entered the site on the browser, we will make sure that it barely turns over or does not respond at all. Why nothing to torment the unfortunate? Run-> Stop . Well, the site came to life again. An unsuccessful idea during such a test is to be distracted for a while and, returning after a few hours (as it happens), find that the site was half a day.
As a meaningful result, we received one number — the maximum value of the Throughput (183 requests per minute). It can be considered the limit of performance. For the beginning of this number it may be enough, for example, it is already clear that 100,000 hosts per day will not pull our site.
Carefully looking at the response time graph, you can see the shelf at the beginning. At this time, the load grew, but the server’s response did not change, that is, it was good. Let's try to study this load range in more detail. Reducing the Number of Threads and increasing the Ramp-Up Period , we get the following picture:

We see that the site poplohelo after 3 virtual users and 150 requests per minute.
For confidence now it makes sense to conduct a test with a static load. We set the Number of Threads = 3, Ramp-Up Period = 0 (we enter the threads immediately) and see what happens. It seems everything is fine, the site responds very quickly. If we want, we remove several such points and build a graph on a piece of paper. These figures are much more reliable than observations on a schedule with a dynamic load.
Let's look now in Aggregate Report . There we have prepared URL statistics.
(It is best to look after the test with a large, but not excessive static load). We are primarily interested in the Average column, the average response time. Often it turns out that there are several heavy pages that primarily load the system, and if you pull them off, the overall performance increases many times (it’s best to start optimizing from pages that are often caused by statistics but work for a long time). In fairness it should be noted that not always the longest-playing pages make the greatest contribution to the load, but more often it is.
A couple of words about the interpretation of the received numbers: 3 virtual users, 150 requests per minute. How do these values relate to real users and, say, page requests per day? Practically nothing, we did not set ourselves the goal of simulating a real user. What we have is a relative value, which can be oriented in the process of tuning. In this case, 3 users were obtained when testing according to the site URL list, and the “log” does not contain images, css and other resources. So 150 per minute just correspond to real page requests per minute. If we used a real log, then we can take the Aggregate Report , export it to csv (there is a Save Table Data button at the bottom), throw all references to resources out of it, count the remaining hits and divide by the test duration.
In conclusion, I want to warn about one drawback of the described method. Since all virtual users execute requests in the same order, caching efficiency at all levels will be very high. In reality, the efficiency will be less, and this brings in the results of our research with a difficult-to-estimate error (by the way, it will be necessary to write a sampler that pulls the lines from the log in random order ... if the hands reach).
But such a test is done quickly and easily and has good performance, so for a start, IMHO, just right.
Why not avoid these troubles by driving a stress test?
Probably, someone stops the misconception that load testing is a very difficult matter that requires special knowledge. However, not the gods burn pots. If the choice is to test not too professionally, or not to test at all, I would choose the first one. Moreover, it is very easy to organize a primitive performance test. You can use online tools (see, for example, Load Testing in a quick way ), or you can do it yourself, it is not much more difficult.
')
Under the cut, I tell you how to organize a simple site load test from scratch using Apache JMeter .
I just want to warn you that the described approach (Log Replay) works well for sites, and is not suitable for web applications that actively use POST, and also, by its simplicity, ignores the existence of cookie-based sessions. In addition, it is undesirable to test a project deployed at 127.0.0.1, the results are quite distorted because JMeter and the site slow down each other (on the other hand, it’s bad when the server is far away - delays are interfering).
We will need:
- JMeter
- Installed Toad , in our time it is found in almost any car
- Access log of our site. If the access log is empty, nothing prevents us from replenishing it slightly by picking up a browser and climbing the site. You can pass the site came under the arm of a crawler, such as HTTrack or Xenu . If the web server is IIS, then you must first switch the log format to NCSA, understood by the JMeter parser. You should not take a log from under a working server (when he writes there), it is better to take the already closed, say, yesterday, or suspend the web server for the time of logging. The log should be viewed with a text editor for correctness.
There is also a good way to generate a file, which for JMeter will come off the log, and without going into the server's file system. We get somewhere from the list of site URLs. An acceptable list makes Xenu in the scan report. Paste this list into a text file. It will turn out something like
http://test.local/index.php
http://test.local/news/event-12.php
...
We make a global replay "http: //test.local" on "" GET "(with quotes and spaces), we get
"GET /index.php
"GET /news/event-12.php
...
This parser format eats well, taking it at face value (you do not need to close the quotation marks at the end of the line).
So, download JMeter ( http://jakarta.apache.org/site/downloads/downloads_jmeter.cgi , expand the archive, go to the bin directory and run jmeter.bat (do an example under Windows). After a short pause, the GUI of a traditional toad will start .
On the left we observe a tree of 2 nodes: TestPlan and Workbench (we forget about the second one immediately, we will not need it). On Test Plan, right click and say Add-> Thread Group (in the interface you can see a lot of chips of different degrees of utility, but we are not distracted now, but go to our test in the shortest way, then we will explore the extensive capabilities of JMeter in more detail) .
Thread group added:
We will not change anything here. The numbers all cost 1 each, which is good. This is a single virtual user, once or twice running the script (in the case of the Access Log Sampler we use, it will execute one request that corresponds to the first line of the log). And we do not need more to debug the test.
We will not rename the Test Plan and Thread Group either; these names are unique within the test.
Right click on the Thread Group add Access Log Sampler (Thread Group-> Add-> Sampler-> Access Log Sampler)
We drive in the server address and local path to the access log (we dragged it from the server and put it on our disk):
Now add to the test viewer:
- Thread Group-> Add-> Listener-> View Results in Table
- Thread Group-> Add-> Listener-> Graph Results
- Thread Group-> Add-> Listener-> Aggregate Report
The test plan is ready, we proceed to testing it :) and debugging (nothing, nothing, it can make money the first time).
File-> Save , and so every time after making changes to the test plan. This is important, the JMeter hangs another time, and the test has to be restored from memory.
Run-> Clear All (the first time you can not do, but then you still need).
Run-> Start .
And we go to look at the View Results in Table . If we are lucky, there will be one line, with a green tick in the Status column.
If something went wrong, the status will be an error:
If this is the case, go read our TestPlan.log. As a rule, according to reports it can be guessed exactly what has broken. For example, if the server being tested does not respond, the following is displayed in the log:
rc="Non HTTP response code: java.net.ConnectException" rm="Non HTTP response message: Connection refused: connect" . Such a text is rc="Non HTTP response code: java.net.ProtocolException" rm="Non HTTP response message: Invalid HTTP method: null" most likely indicates that the access log line is incorrectly parsed.We set, figured out, or all at once went clean. Go to the properties of the Thread Group and set the Loop Count: Forever
Run (File-> Save, Run-> Clear All, Run-> Start). We go to look in View Results in Table . It should turn out like this:
In the last line of the error, this JMeter is experiencing a breakdown because the file has ended (apparently, used to work with infinite files). Unfortunately, at the end of the file, the script stops, ignoring the setting of Action to be taken after a Sampler error = Continue (this seems to me a bug, and the developers must have features). To prevent this from distorting the test results, it is better to take long enough access logs. It is easy to organize a long file from a short file using copy in the command line or Ctrl + C, Ctrl + V in a text editor. For our experiments, more than 1000 lines in the log are hardly needed.
Still, before starting the test, add a random delay ( Uniform Random Timer ) of 0-1000 milliseconds to the beginning of the script, it usually helps to smooth out some graphs. As a result, the script works like this: waits for a random number of milliseconds, reads a line from the log, makes an HTTP request, sends the results to the listeners, waits again, reads the next line, and so on.
We do the first sighting test. In the properties of the thread group, we put: Number of Threads (users): 100, Ramp-Up Period (in seconds) : 100. We are going to set 100 virtual users on the site, putting them into battle one by one within 100 seconds, that is, by user per second. I took the numbers 100 and 100 from somewhere from the ceiling, but you have to start somewhere.
Once again, we remind ourselves that we have good chances to slow down or even fill up the site (which may not be good if we are talking about a project that is already running). OK, being sane and sober, realizing responsibility for our actions, we begin.
File-> Save, Run-> Clear All, Run-> Start and go to watch Graph Results. We see, say, such a picture:
In the upper right corner you can see the current number of virtual users.
What does this chart tell us? The average response time ( Average ) increases, and the processing speed ( Throughput ) does not change. This means that somewhere on the server operations are queued, and there is not enough performance to service all requests. Having entered the site on the browser, we will make sure that it barely turns over or does not respond at all. Why nothing to torment the unfortunate? Run-> Stop . Well, the site came to life again. An unsuccessful idea during such a test is to be distracted for a while and, returning after a few hours (as it happens), find that the site was half a day.
As a meaningful result, we received one number — the maximum value of the Throughput (183 requests per minute). It can be considered the limit of performance. For the beginning of this number it may be enough, for example, it is already clear that 100,000 hosts per day will not pull our site.
Carefully looking at the response time graph, you can see the shelf at the beginning. At this time, the load grew, but the server’s response did not change, that is, it was good. Let's try to study this load range in more detail. Reducing the Number of Threads and increasing the Ramp-Up Period , we get the following picture:
We see that the site poplohelo after 3 virtual users and 150 requests per minute.
For confidence now it makes sense to conduct a test with a static load. We set the Number of Threads = 3, Ramp-Up Period = 0 (we enter the threads immediately) and see what happens. It seems everything is fine, the site responds very quickly. If we want, we remove several such points and build a graph on a piece of paper. These figures are much more reliable than observations on a schedule with a dynamic load.
Let's look now in Aggregate Report . There we have prepared URL statistics.
(It is best to look after the test with a large, but not excessive static load). We are primarily interested in the Average column, the average response time. Often it turns out that there are several heavy pages that primarily load the system, and if you pull them off, the overall performance increases many times (it’s best to start optimizing from pages that are often caused by statistics but work for a long time). In fairness it should be noted that not always the longest-playing pages make the greatest contribution to the load, but more often it is.
A couple of words about the interpretation of the received numbers: 3 virtual users, 150 requests per minute. How do these values relate to real users and, say, page requests per day? Practically nothing, we did not set ourselves the goal of simulating a real user. What we have is a relative value, which can be oriented in the process of tuning. In this case, 3 users were obtained when testing according to the site URL list, and the “log” does not contain images, css and other resources. So 150 per minute just correspond to real page requests per minute. If we used a real log, then we can take the Aggregate Report , export it to csv (there is a Save Table Data button at the bottom), throw all references to resources out of it, count the remaining hits and divide by the test duration.
In conclusion, I want to warn about one drawback of the described method. Since all virtual users execute requests in the same order, caching efficiency at all levels will be very high. In reality, the efficiency will be less, and this brings in the results of our research with a difficult-to-estimate error (by the way, it will be necessary to write a sampler that pulls the lines from the log in random order ... if the hands reach).
But such a test is done quickly and easily and has good performance, so for a start, IMHO, just right.
Source: https://habr.com/ru/post/84190/
All Articles