Google Chart Tools APIs
 Google has released programming interfaces for graphing and charting the Chart API, which are free and free to use. They are united in a single framework Chart Tools .
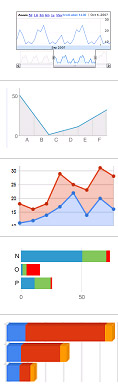
Using the Chart API, charts are generated by sending a simple URL request to a Google chart server. Examples of possible diagrams can be viewed in the gallery . Among other things, the Chart API supports dynamic icons , QR codes and mathematical formulas .
As for the Visualization API (Interactive Chart API), interactive charts are created through the JavaScript library developed by Google ( examples ). Data sources can be, for example, Google Docs tables or Oracle PL / SQL databases.
')
via Google Code Blog
Source: https://habr.com/ru/post/84008/
All Articles