jQuery.colorit - highlighting values in dull tables
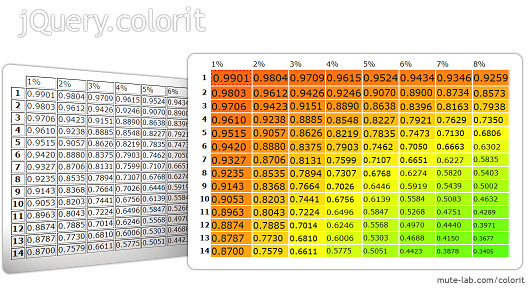
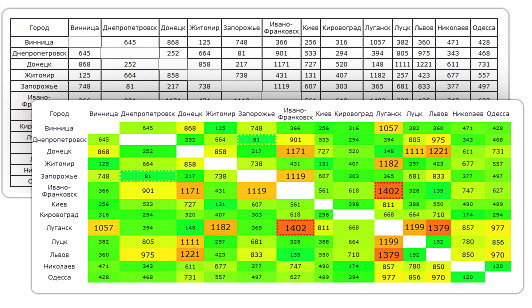
The ColorIt plugin (aka “Coloring”) turns boring tables into colored mosaics, facilitating data perception. One glance at the table will be enough to understand the overall picture (“average temperature in the hospital”), as well as to find extreme values.
Opportunities
- Highlight the background of the cell color proportional to its value
- Proportional increase of cell font (Or decrease - if you want to select the lowest values. For example, the most attractive price)
- Adjust brightness, color, saturation
- Adjusting the width of the color range
- The ability to add legends. The legend also allows you to determine the nature of the distribution of values
- Highlight styles of maximum and minimum values
On the page of the plugin, you can play around with the parameters and choose the optimal values for a particular application.
')
The plugin can be set not only on the tables, but also on any elements:

In the next version the plugin will
- show, when hovering over a cell, a fraction of the value of the sum or the maximum
- highlight the closest to the mean value in the table and on the legend
Disclaimer:
Without being a professional programmer once, I implemented the idea as I could. And therefore:
- I am not responsible for any side effects, for example, if you start to color the buttons on the keyboard :)
- I will gladly accept the help of code improvement professionals
The first plugin and the first topic - do not kick much, please - I have a weak heart and an unstable psyche :)
Demo, documentation and download here
Source: https://habr.com/ru/post/83605/
All Articles