FunGraph.ru - a little humor, the language of statistics

There are three types of lies: lies, vile lies and statistics of the People (now) wisdom.
We built, built, and, finally, built the Cartoon about Cheburashka
')
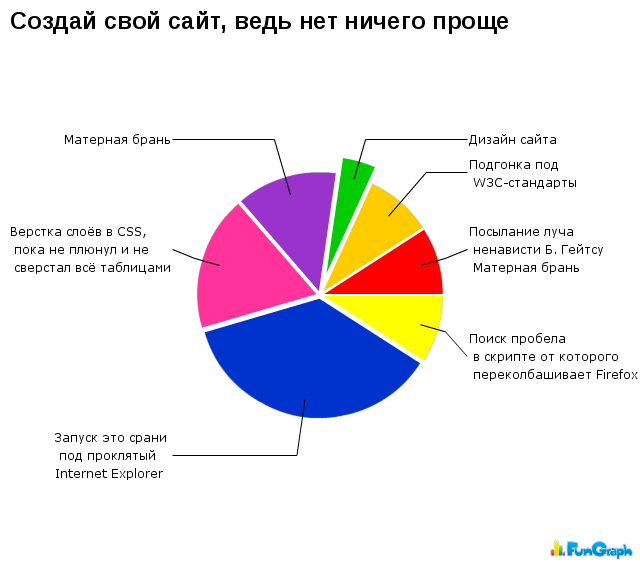
Good day, dear habrazhiteli. I want to tell you about a small project that we created with friends - FunGraph . The project is an entertainment resource, the subject of which is the design of jokes, anecdotes, stories, and other life situations in the form of graphs. Here is one example (close to the habr theme =)):

Funny pictures and graphics
As with any entertainment resource - one of the main functions of the project is to show content - in our case these are all sorts of graphics. For the convenience of users, we have divided all site content into two lists - Home and New . All new graphs published by users fall into the new ones (more about this later), and only those graphs that were liked by at least 10 users so much that they are not too lazy to vote for it fall onto the main page. We made the voting very simple - on the “+1” principle - either you like the schedule or the second =)
Now about the most interesting - the publication of graphs. To do this, we wrote a flash component. With it, you can draw a graph by setting all the necessary parameters. So far, only two types of charts are available - Bars and Pie. Plans for the near future - Euler Diagram .


Because the capabilities of our Plotter (here is its name, our flash component =)) are limited, and a large number of graphs have already been published on the Internet, perfectly suited to the subject of the project, we added the ability to download the graph as a normal picture.
Charts can be created only by registered users, but we have tried to make this procedure quite simple - OpenID authorization is at your service. Also, at the moment, we have included the pre-moderation of all created graphs - it seems to us that at first this function is necessary for our project. But soon we will return to the discussion of this issue.
From the rest - we have comments on the charts that can be written by both registered users and guests. We have tags that are automatically filled in with data from the Plotter (in case you draw the graph yourself), which does not interfere with replacing the generated tags with your own. And if there are tags, then there is a tag cloud - where do without it =). We also have code to insert graphics into a blog (HTML) and a forum (BBCode).
It is also worth noting that we added feedback from reformal.ru to our project, and are ready to listen to all your suggestions and suggestions about our first pancake, which we hope still turned out not to be a lump =) And, of course, we are waiting for feedback / suggestions / wishes / bug reports in comments to this topic.
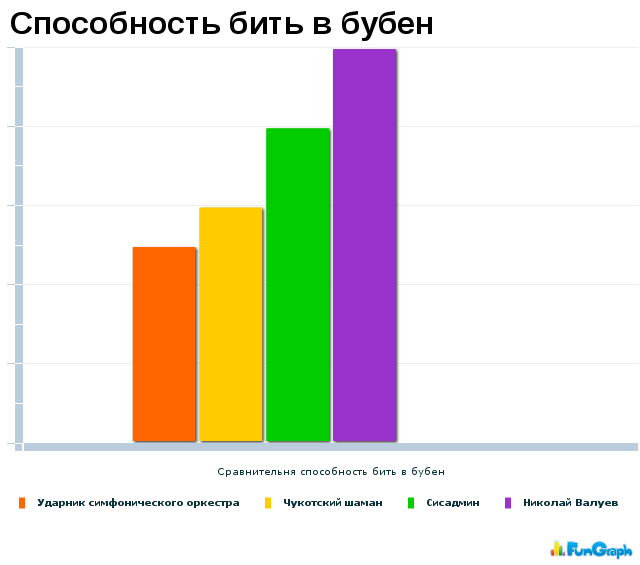
Well, instead of a postscript one more graph:

Funny pictures and graphics
Source: https://habr.com/ru/post/81853/
All Articles