Social graph analysis

The number of US patent applications related to social networks in the last 5 years has grown by 250% every year ( link ). For example, one corporation filed a patent application for a pricing method that takes into account the position of the buyer in the social graph ( discussion on Slashdot ). Another corporation recently embodied the most simplified version of this scheme, selling its new phones to influential social graph nodes for $ 0 and the rest for $ 530.
The analysis of social networks ( Social Network Analysis ) existed long before the Internet, but recently it is gaining momentum.
It was interesting for me to see how effectively the algorithm highlighting clusters in graphs would work for some groups on Twitter that are of interest to me.
')
On January 23, #UKRTWEET , the first all-Ukrainian barcamp dedicated to Twitter, will be held in Zaporizhia. The graph above shows which of its participants, with whom he speaks and whom he mentions.
The note below is devoted to the analysis of this graph. All the code for the scripts used here is on github . The presentation, to some extent, is inspired by Toby Segaran’s book “We program the collective mind” recently mentioned on Habré , the code of which is available on the author’s website .
I also spoke about data mining on Twitter on January 16 at the first “Coffee and Code” meeting in Donetsk this year. Therefore, here in parallel I will analyze the group of people from Donetsk who write on Twitter. By the way, this year the Donetsk meetings will be regular - every third Saturday of the month (next February 20). Watch out for the group .
1. Getting information
For a start, we get a list of all group members. The list of #UKRTWEET members is on the barcamp page. Download and parse it using BeautifulSoup ( code ). For people who tweet from Donetsk, I keep a list @ dudarev / donetsk . We save its members with the help of the tweepy library ( code ).
For each participant, download the last 100 tweets and save them. Tweepy automatically parses JSON, and since this time we want to keep the data as it is, we tweak the tweepy.API class ( code ) a little.
2. What are they talking about?
Now you can analyze the information. And first - a couple of observations not related to the social graph. Let's see which hashtags are most often used by each group. To do this, we write a utility that accepts a string and returns a list of all hashtags in it. For its writing TDD is very useful ( see the code ). With the help of this utility parsim all tweets ( code ).
The most frequently mentioned hashtags by #UKRTWEET members (the number in brackets is the number of different people who used this hashtag):
- ukrtweet (20)
- sledui (20)
- elect_ua (16)
- ru_ff (10)
- zp_ua (9)
- nicua (9)
- google (9)
- twitter (7)
- habr (7)
People from Donetsk mentioned:
- donetsk (31)
- habr (12)
- radiot (8)
- sledui (7)
- ru_ff (7)
- google (7)
- wave (6)
- linux (6)
As you can see, in each group, the hashtag describing the group is in the first place by usage. There are common interests: habr, ru_ff, sledui, google.
3. When they say
Let's see at what time, the group is most active. To do this, use the same script that runs through all the tweets, but this time we will create lists of the number of tweets at a given hour of the day and save them in separate files (the option '-t' when called from the command line). Draw diagrams using the Matplotlib library ( code ).
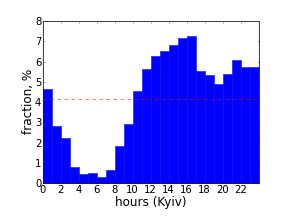
Participants #UKRTWEET are active above average from 10 am to 1 am, Kiev time, with a peak around 5 pm.

Donetsk residents are active at the same time, but the peak is observed around 11 pm. Perhaps this is because people gathering for barcamp consider Twitter as a working tool and are active in it during working hours. Although, due to recent holidays, this data may not be indicative.
4. Social graph
The graph from Twitter data can be built in various ways. Here we will follow the following construction: if person A mentioned person B at least once (no matter the retweet or the answer), we build an oriented edge from vertex A to vertex B. The graph is not weighted, that is, we build the edge only once.
The same script with the '-g' option builds from the saved tweets a dictionary representing such a graph and saves it in JSON format for further analysis ( code ).
Several quantitative observations. In the #UKRTWEET group, 58% mention someone from the group (61/106). A total of 1221 people mention that 11.5 times the size of the group itself (1221/106).
In the Donetsk group, 51.6% are involved in the group (116/225), and the total number of various references is 6 times more than the group itself (1341/225). It is obvious that people who are going to visit the barcamp on Twitter more actively use it as a means of communication.
5. Authority
Authority in the social graph can be analyzed in different ways. The easiest way is to sort the participants by the number of incoming edges. Who has more - he is more authoritative. This method is suitable for small graphs. Searching on the Internet, Google uses PageRank as one of the criteria for authoritative pages. It is calculated using a random walk on a graph, where the nodes are the pages and the edge between the nodes is if one page refers to another. The random walker moves along the graph and from time to time moves to a random node and starts the walk again. PageRank is equal to the proportion of stay on a node for the entire time of wandering. The larger it is, the more authoritative the node is.
Here we will focus only on the above two criteria. It is worth mentioning that when analyzing social graphs, much attention is paid to various centralities . Using them as an authoritativeness criterion may make more sense for more distributed social graphs.
One of the most common Python graph libraries is NetworkX . We will use it. Having created a graph G, it is very convenient to calculate its various parameters. So, for example, to calculate the PageRank of all nodes, it is enough to write:
pr = networkx.pagerank (G)
I would like to emphasize that all the numbers below are for groups artificially selected from the twitter-sphere. Other members of these groups may be globally more influential and authoritative. The numbers below are for communications within these groups.
Let's display the dependence of PageRank for all nodes on the number of nodes that point to them ( code ).

Naturally, the great authority of the two organizers ( @karelina and @ u02 ). The well-known Ukrainian blogger @woofer_kyyiv has high authority measured in PageRank, although fewer people mention it, but they mention it evenly across a group (from different communities). The authority of the official barcamp account ( @ukrtweet ) is lower with more mention. One of the interpretations: people prefer to communicate and mention people. Perhaps, therefore, in many official Western accounts the names of the broadcasters are clearly indicated.
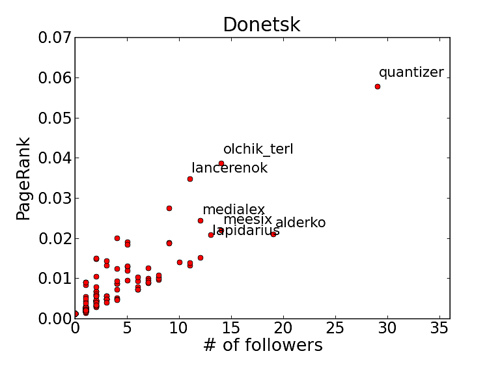
The undisputed leader within the Donetsk group is @quantizer . Differences in PageRank with similar numbers of references for the following participants can be interpreted, for example: @olchik_terl and @lancerenok communicate more with people from different parts of the social graph of the group, while @medialex , @lapidarius , @meesix , @alderko interact more with their local communities (mainly identified on a professional basis, more on this below), so the second PageRank group is slightly lower than the first.
6. Influencing from the outside
People outside groups also influence groups. We define the most influential, just like we did with hashtags: sort people out of groups according to the number of people who mention them in a group (the script is the same as the parsit, but with the -g -o options it creates the data / friends_outside_counts.txt file).
For #UKRTWEET (in brackets - the number of different people from the group mentioned):
- podarok (16)
- taras (11)
- artemzeleny (11)
- blogoreader (10)
- yaroslavazhnyuk (9)
- wedmid (9)
- matteush (9)
For Donetsk:
- bobuk (12)
- olyapka (11)
- ekozlov (8)
- boomburum (7)
- abakala (7)
This approach can be used to search for interesting people. If you are interested in a group, then probably the people that this group mentions may also be of interest to you.
As an improvement, it is possible to add not units, but PageRank of those mentioning. So those who from the outside more influence the influential in the group will have more weight. We leave it for those who wish as an exercise with the code.
7. Communities
For algorithmic search for clusters in graphs, modularity optimizing methods are most popular. Modularity is a quantitative parameter that uses the number of internal links within prospective communities and links with external communities. All the results that will be discussed below are obtained using the code posted on the website of the Belgian group , which they described in an article laid out on arxiv. Other people also laid out their code for similar purposes. Also, the clustering algorithm is built into another popular library for working with graphs - igraph .
Graphs with tags and communities displayed using Seadragon, an interesting Microsoft web application that allows you to easily upload large graphic files in an interface like online maps, as well as a single file:
UkrTweet - seadragon file .
Donetsk - seadragon , file .
We used a script to find communities and a script to draw a graph.
8. Labels for communities
I would like to get some characteristic of the formed communities. One of the ways is to see which lists people from communities have joined. We download all lists in which people from groups ( code ) were included. We sort the groups by total PageRank and print ten names of the lists that were met for the largest number of people in the group ( code ). In some communities, it is impossible to distinguish talking tags, but in many tags of participants they say a lot. In the table below, communities are sorted by total PageRank, the two most authoritative participants, the number of participants, a few speaking common labels (in brackets the number of people from the communities that were on the respective lists):
Ukrtweet
| Members | Total participants | Tags | Comments |
|---|---|---|---|
| u02, karelina, ... | 12 | zp-ua (10), zp (10) | Around the organizers, mainly from Zaporizhia |
| woofer_kyyiv, gasique, ... | 12 | kyiv (8), mckyiv09 (6), bloggers (6) | Kiev bloggers who met at Media Camp 2009 |
| o_saltan, netocrat, ... | 13 | journalists (7), zp (6) | Journalists, a lot of Zaporozhye |
| b2blogger, maxzalevski, ... | 7 | seo (5), belseo (5), web-marketing (4) | Web marketers and SEO specialists |
Another four communities it is difficult to say something on the basis of lists. For example, I came to the community, from which many retweet about tweetingplaces , one of my projects. But we have no common names for the lists, except for ukrtweet.
Donetsk
| Members | Total participants | Tags | Comments |
|---|---|---|---|
| quantizer, alderko, ... | 21 | donntu (10) | One community from DonNTU |
| decoy, andrulik, ... | 21 | cnc-donetsk (9) | Many former "Coffee and Code" meetings |
| medialex, iammarat, ... | 13 | christians (13) | Believers |
| lapidarius, kolgushev, ... | eleven | seo (2), medianext-ua (2) | Related to new media |
| meesix, bezlik, ... | 9 | donntu (2) | The second community related to DonNTU |
| alexeyosipenko, a_djo, ... | eight | donetsk-rubyists (5), cnc-donetsk (3) | Ruby fans who were also on Kik |
Interestingly, olchik_terl and lancerenok, which were mentioned earlier, and who had PageRank more than other people, who are also often mentioned, get into active communities that are poorly described by lists. They communicate more with the whole group, rather than within professional communities.
Exercises
Twitter, thanks to its API, provides fertile fields for extracting and analyzing information on social graphs. Here are some exercises for those who want to delve more.
- What tools in the group are most often used to tweet (web, TweetDeck, Echofon, ...)?
- Mentioned centrality. Display betweenness_centrality vs. eigenvector_centrality using NetworkX.
- Get outside influences weighted via PageRank.
- Using the code of the book “We Program the Collective Mind”, select clusters in a group not on the basis of a graph, but on the basis of common lists.
Used libraries
BeautifulSoup
for parsing HTML
tweepy
Twitter API
NetworkX .
for working with graphs
Matplotlib
allows you to draw graphs and charts
igraph
a package for working with graphs, there is an interface in Python (not used here, but mentioned)
Source: https://habr.com/ru/post/81225/
All Articles