We draw coordinates on the map using PHP + GDLib
It so happened that due to my service I am engaged in geo-search. And often I need to show the coordinates of users on the map in order to do any analyzes. For this purpose, I, up to a certain time, successfully used Google Maps, until, one day, I didn’t need to map quite a few 16 million coordinates.
How did I do it?
The DynamicDataDisplay library, which was written here not long ago, immediately came to mind. But unfortunately I needed to draw a map on a Linux server. And, in general, even if it were possible to run it on Linux, it would be extremely problematic to do so. I decided not to look for something ready, but to sort it out at the same time with what I had long wanted to do.
So, we need: PHP, GDLib and the very small amount of encyclopedic knowledge.
')
For knowledge, go to Wikipedia . Briefly tell the theory.
The earth is round and the monitors are flat. In order to be able to watch the earth on a monitor - there are methods of projecting the globe on a plane.
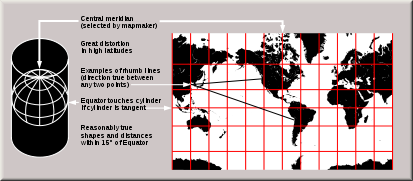
One of such methods, the projection of Gerard Mercator, is that the globe is pulled around the poles into a cylinder, and then the resulting cylinder is cut into 180 meridians, resulting in a flat image.
Since the map turns out to be very stretched around the poles, small pieces at the top and bottom of the map are cut off (leaving a range of latitudes from about -85 ° to 85 °). The result is such a map:
On Wikipedia, you can download a high-resolution map of the Mercator projection on which we will draw.
Now how to display a point with a given coordinate on this map?
The longitude in the Mercator projection is not distorted. So in order to find out the point X on the map, we just need to multiply the longitude by the scale of the map in X and add the resulting number to the point indicating the middle of the map.
With latitude more complicated. The scale increases from the equator to the poles. The farther away from the equator, the higher the distortion.
Scale up according to this formula:

Here φ is the latitude (in radians), y is the distortion factor.
Knowing this, we multiply the latitude by the scale of Y and the distortion factor.
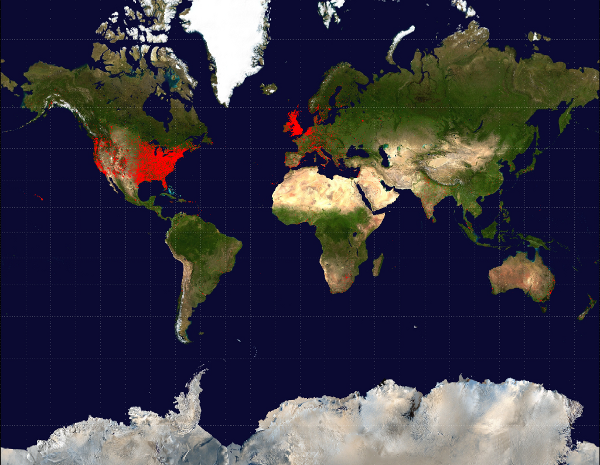
As an example, I made a small script that draws points on a map. There are several examples of use.
I was able to map my 16 million coordinates with this script in about 2 minutes. It turned out about the following:
Thanks for attention.
UPD: The user axshavan told in comments about equidistant projections .
I modified the script a bit, added support for this projection into it.
Briefly, the differences from the projection of the mercator:
The projection is not distorted in latitude, acc. Latitude is considered the same as longitude.
There are several advantages to using this projection: firstly, the range of latitudes slightly increases, and secondly, points are calculated somewhat faster, because mathematical operations are primitive.
However, there is one minor drawback - the map is a bit “compressed” vertically.
Links to the script:
GeoMap.tgz (dropbox)
GeoMap.tgz (google drive)
How did I do it?
The DynamicDataDisplay library, which was written here not long ago, immediately came to mind. But unfortunately I needed to draw a map on a Linux server. And, in general, even if it were possible to run it on Linux, it would be extremely problematic to do so. I decided not to look for something ready, but to sort it out at the same time with what I had long wanted to do.
So, we need: PHP, GDLib and the very small amount of encyclopedic knowledge.
')
For knowledge, go to Wikipedia . Briefly tell the theory.
The earth is round and the monitors are flat. In order to be able to watch the earth on a monitor - there are methods of projecting the globe on a plane.
One of such methods, the projection of Gerard Mercator, is that the globe is pulled around the poles into a cylinder, and then the resulting cylinder is cut into 180 meridians, resulting in a flat image.
Since the map turns out to be very stretched around the poles, small pieces at the top and bottom of the map are cut off (leaving a range of latitudes from about -85 ° to 85 °). The result is such a map:
On Wikipedia, you can download a high-resolution map of the Mercator projection on which we will draw.
Now how to display a point with a given coordinate on this map?
The longitude in the Mercator projection is not distorted. So in order to find out the point X on the map, we just need to multiply the longitude by the scale of the map in X and add the resulting number to the point indicating the middle of the map.
With latitude more complicated. The scale increases from the equator to the poles. The farther away from the equator, the higher the distortion.
Scale up according to this formula:
Here φ is the latitude (in radians), y is the distortion factor.
Knowing this, we multiply the latitude by the scale of Y and the distortion factor.
As an example, I made a small script that draws points on a map. There are several examples of use.
I was able to map my 16 million coordinates with this script in about 2 minutes. It turned out about the following:
Thanks for attention.
UPD: The user axshavan told in comments about equidistant projections .
I modified the script a bit, added support for this projection into it.
Briefly, the differences from the projection of the mercator:
The projection is not distorted in latitude, acc. Latitude is considered the same as longitude.
There are several advantages to using this projection: firstly, the range of latitudes slightly increases, and secondly, points are calculated somewhat faster, because mathematical operations are primitive.
However, there is one minor drawback - the map is a bit “compressed” vertically.
Links to the script:
GeoMap.tgz (dropbox)
GeoMap.tgz (google drive)
Source: https://habr.com/ru/post/81007/
All Articles