List of Javascript libraries for drawing graphs and charts 2
We continue the topic of data visualization on the Internet.
Previous topics:
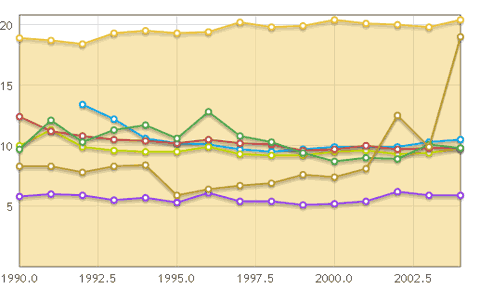
flot - Javascript library for jQuery, allows you to build graphics.
License: MIT
')
Website: code.google.com/p/flot
Browsers: Internet Explorer 6/7/8, Firefox 2.x +, Safari 3.0+, Opera 9.5+ and Konqueror 4.x + with canvas

API Google Chart allows you to dynamically create charts. Supports line, bar, pie and radar charts, as well as venn diagrams, scatter plots, sparklines, maps, google-o-meters and QR codes.
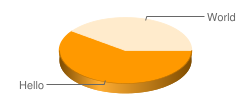
To view the Chart API in action, open a browser window and copy the following URL into the address bar:
habrastorage.org/getpro/habr/post_images/d2b/c94/dfa/d2bc94dfab98371241fcbf005d576fd1.png
Result:

Site: code.google.com/intl/ru/apis/chart
For PHP programmers: luddep.se/notebook/2008/04/13/charts-php-and-google-charts-api
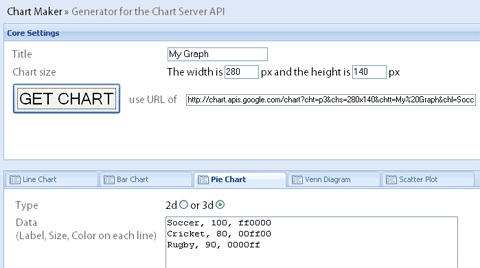
ChartMaker is an open source library built on the Ext JS Javascript library and is a wrapper for the Google Chart API.
Website: almaer.com/chartmaker

Processing.js is an open programming language for those who want to program images and animations without using flash or java applets. Processing.js uses Javascript for drawing as well as canvas.

Website: processingjs.org
Browsers: FireFox, Safari, Opera and Chrome
License: free use
moowheel is used to visualize links between objects using a javascript and canvas element. Requires Mootools 1.2.
Demo: www.unwieldy.net/projects/moowheel/demo/large.html
Website: www.unwieldy.net/projects/moowheel
Google Code: code.google.com/p/moowheel
License: MIT
JSXGraph allows you to draw geometric objects, graphs and charts.
Opportunities:
* Euclidean geometry: points, lines, circles, intersections, perpendicular lines, angles
* graphics: Graphs, parametric curves, polar curves, data plots, Bezier curves
* differential equations
* Lindenmayer systems
* sliders
* animation
* polynomial interpolation, splines
* normals
* vectors

Website: jsxgraph.uni-bayreuth.de/wp
License: LGPL - Lesser GNU General Public License
Browsers: Mozilla Firefox 2.0+, Opera, Safari 3+, Google Chrome, Microsoft Internet Explorer 6+
ProtoChart is an open source library that uses canvas and Prototype.

Website: www.deensoft.com/lab/protochart
Opportunities:
* Line, bar, pie, curve, mix and area charts
* support multiple data series
* customizable grids, borders, background
* customizable axes
* supports IE6 / 7, FF2 / 3 and Safari
* works on iPhone
jQuery Sparklines - plugin for building sparklines on the fly.

Website: www.omnipotent.net/jquery.sparkline
Browsers: Firefox 2+, Safari 3+, Opera 9, Google Chrome and Internet Explorer 6, 7 & 8.
License: BSD
fgCharting - jQuery plugin, uses canvas to build gracics from tables.

Website: www.filamentgroup.com/lab/creating_accessible_charts_using_canvas_and_jquery
License: MIT
Browsers: IE6, IE7, IE8, Firefox 2, Firefox 3.5, Safari 3 and 4, Opera 9.
For now. Next will be the Flash / Sliverlight library, if the question is relevant, of course :)
Thanks for attention!
Previous topics:
- Amazing Charts with New Chart Control
- Visualization of directed graphs on the web
- List of Javascript libraries for drawing graphs and diagrams - habrahabr.ru/blogs/javascript/79960 (blog post - msug.vn.ua/blogs/akrakovetsky/archive/2010/01/04/javascript-charting-libraries.aspx )
flot
flot - Javascript library for jQuery, allows you to build graphics.
License: MIT
')
Website: code.google.com/p/flot
Browsers: Internet Explorer 6/7/8, Firefox 2.x +, Safari 3.0+, Opera 9.5+ and Konqueror 4.x + with canvas

Google Chart API
API Google Chart allows you to dynamically create charts. Supports line, bar, pie and radar charts, as well as venn diagrams, scatter plots, sparklines, maps, google-o-meters and QR codes.
To view the Chart API in action, open a browser window and copy the following URL into the address bar:
habrastorage.org/getpro/habr/post_images/d2b/c94/dfa/d2bc94dfab98371241fcbf005d576fd1.png
Result:

Site: code.google.com/intl/ru/apis/chart
For PHP programmers: luddep.se/notebook/2008/04/13/charts-php-and-google-charts-api
ChartMaker is an open source library built on the Ext JS Javascript library and is a wrapper for the Google Chart API.
Website: almaer.com/chartmaker

Processing.js
Processing.js is an open programming language for those who want to program images and animations without using flash or java applets. Processing.js uses Javascript for drawing as well as canvas.

Website: processingjs.org
Browsers: FireFox, Safari, Opera and Chrome
License: free use
moowheel
moowheel is used to visualize links between objects using a javascript and canvas element. Requires Mootools 1.2.
Demo: www.unwieldy.net/projects/moowheel/demo/large.html
Website: www.unwieldy.net/projects/moowheel
Google Code: code.google.com/p/moowheel
License: MIT
JSXGraph
JSXGraph allows you to draw geometric objects, graphs and charts.
Opportunities:
* Euclidean geometry: points, lines, circles, intersections, perpendicular lines, angles
* graphics: Graphs, parametric curves, polar curves, data plots, Bezier curves
* differential equations
* Lindenmayer systems
* sliders
* animation
* polynomial interpolation, splines
* normals
* vectors

Website: jsxgraph.uni-bayreuth.de/wp
License: LGPL - Lesser GNU General Public License
Browsers: Mozilla Firefox 2.0+, Opera, Safari 3+, Google Chrome, Microsoft Internet Explorer 6+
Prototype + Canvas = ProtoChart
ProtoChart is an open source library that uses canvas and Prototype.

Website: www.deensoft.com/lab/protochart
Opportunities:
* Line, bar, pie, curve, mix and area charts
* support multiple data series
* customizable grids, borders, background
* customizable axes
* supports IE6 / 7, FF2 / 3 and Safari
* works on iPhone
jQuery Sparklines
jQuery Sparklines - plugin for building sparklines on the fly.

Website: www.omnipotent.net/jquery.sparkline
Browsers: Firefox 2+, Safari 3+, Opera 9, Google Chrome and Internet Explorer 6, 7 & 8.
License: BSD
fgCharting
fgCharting - jQuery plugin, uses canvas to build gracics from tables.

Website: www.filamentgroup.com/lab/creating_accessible_charts_using_canvas_and_jquery
License: MIT
Browsers: IE6, IE7, IE8, Firefox 2, Firefox 3.5, Safari 3 and 4, Opera 9.
For now. Next will be the Flash / Sliverlight library, if the question is relevant, of course :)
Thanks for attention!
Source: https://habr.com/ru/post/80027/
All Articles