List of Javascript libraries for drawing graphs and charts
About the visualization of graphs in the web talked here , inspired by this article.
Under the cat review of JavaScript libraries for drawing graphs, charts and other beauty.
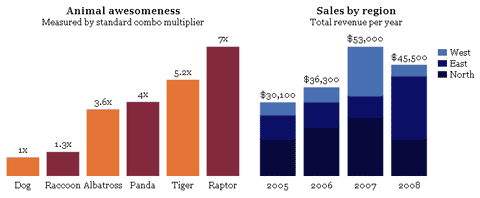
Uses jQuery.
Website: xaviershay.github.com/tufte-graph
')

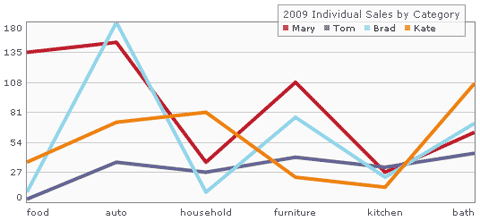
dygraphs is an open source JavaScript library for drawing time series.

Website: www.danvk.org/dygraphs
Demo: www.danvk.org/dygraphs/tests
About Highcharts wrote here .

Website: www.highcharts.com
gRaphaël is an open source library that allows you to draw pie, bar, line or dot charts diagrams.

Website: g.raphaeljs.com
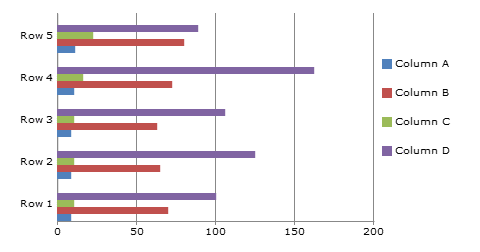
MilkChart - MooTools library for converting tables to charts.

Uses and supports the following chart types:
* Column
* Bar
* Line
* Scatter
* Pie
Website: code.google.com/p/milkchart
Visualize is a jQuery plugin that converts tables to charts using the canvas tag.

The use is very simple (allows you to draw line, pie, bar or area charts):
$ ('table'). visualize ();
Website: http://www.filamentgroup.com/
A library for drawing treemaps, radial layouts, bar charths, pie charts, and other canvas-based charts.

Website: thejit.org
jqPlot - jQuery plugin, can draw line and bar charts.

Website: www.jqplot.com
Protovis - JavaScript library, uses canvas.

Website: vis.stanford.edu/protovis
Which library is better, which one is not - it is difficult to say, I myself use the asp.net chart control for such cases, although many of these are very much nothing :)
The thought is enough for now. If this topic is interesting, I can continue a series of posts about data visualization on the web.
Thanks for attention!
Under the cat review of JavaScript libraries for drawing graphs, charts and other beauty.
TufteGraph
Uses jQuery.
Website: xaviershay.github.com/tufte-graph
')

dygraphs
dygraphs is an open source JavaScript library for drawing time series.

Website: www.danvk.org/dygraphs
Demo: www.danvk.org/dygraphs/tests
Highcharts
About Highcharts wrote here .

Website: www.highcharts.com
gRaphaël
gRaphaël is an open source library that allows you to draw pie, bar, line or dot charts diagrams.

Website: g.raphaeljs.com
MilkChart
MilkChart - MooTools library for converting tables to charts.

Uses and supports the following chart types:
* Column
* Bar
* Line
* Scatter
* Pie
Website: code.google.com/p/milkchart
Visualize
Visualize is a jQuery plugin that converts tables to charts using the canvas tag.

The use is very simple (allows you to draw line, pie, bar or area charts):
$ ('table'). visualize ();
Website: http://www.filamentgroup.com/
InfoVis
A library for drawing treemaps, radial layouts, bar charths, pie charts, and other canvas-based charts.

Website: thejit.org
jqPlot
jqPlot - jQuery plugin, can draw line and bar charts.

Website: www.jqplot.com
Protovis
Protovis - JavaScript library, uses canvas.

Website: vis.stanford.edu/protovis
Which library is better, which one is not - it is difficult to say, I myself use the asp.net chart control for such cases, although many of these are very much nothing :)
The thought is enough for now. If this topic is interesting, I can continue a series of posts about data visualization on the web.
Thanks for attention!
Source: https://habr.com/ru/post/79960/
All Articles