Highcharts: Beautiful, dynamic charts in 5 minutes!

Highcharts - a library for creating charts written in JavaScript, makes it easy to add interactive, animated graphics to your website or web application. At the moment, the charts support a large number of linear, circular, column scatter diagrams and many other types of charts.
 Charts work with all popular browsers, including Safari on iPhone.
The minimum version for IE is 6+. Also, browsers support the Canvas element, and in some cases SVG for graphical rendering.
Charts are free for non-commercial use, but the price for commercial use on one site is $ 80, unlimited use is $ 360. Read more
 The following types of graph output are supported:
line, spline, area, areaspline, column, bar, pie and scatter. and they can be combined between each other in the output to the end user, and have the ability to disable any of them in real time directly by the user for easy disassembly.
')
Data for plotting can be taken from JS itself, from a local file, database, or from a remote server.
- Charts run on pure JS and do not require any plug-ins or Flash;
- The output of the charts is quite simple, and they can be used even by beginners in web development;
- There is an increase in individual areas;
- Skins / themes support;
- Support tooltip with information output;
- Most types of charts have X-axis date-time support;
- Library size ~ 18kb;
Offsite , Gallery Charts with examples

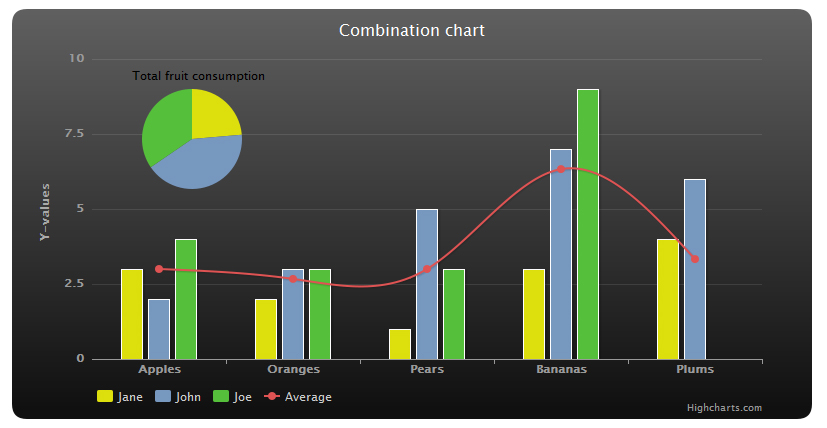
An example of the output graph in the accompanying post image:
var chart = new Highcharts.Chart({
chart: {
renderTo: 'container'
},
title: {
text: 'Combination chart'
},
xAxis: {
categories: ['Apples', 'Oranges', 'Pears', 'Bananas', 'Plums']
},
tooltip: {
formatter: function() {
var s;
if (this.point.name) { // the pie chart
s = ' Total fruit consumption <br/>'+
this.point.name +': '+ this.y +' fruits';
} else {
s = ' '+ this.series.name +' <br/>'+
this.x +': '+ this.y;
}
return s;
}
},
labels: {
items: [{
html: 'Total fruit consumption',
style: {
left: '40px',
top: '8px',
color: 'black'
}
}]
},
series: [{
type: 'column',
name: 'Jane',
data: [3, 2, 1, 3, 4]
}, {
type: 'column',
name: 'John',
data: [2, 3, 5, 7, 6]
}, {
type: 'column',
name: 'Joe',
data: [4, 3, 3, 9, 0]
}, {
type: 'spline',
name: 'Average',
data: [3, 2.67, 3, 6.33, 3.33]
}, {
type: 'pie',
name: 'Total consumption',
data: [{
name: 'Jane',
y: 13,
color: highchartsOptions.colors[0] // Jane's color
}, {
name: 'John',
y: 23,
color: highchartsOptions.colors[1] // John's color
}, {
name: 'Joe',
y: 19,
color: highchartsOptions.colors[2] // Joe's color
}],
center: [100, 80],
size: 100,
showInLegend: false
}]
});
PS: List of other libraries by StWoland
UPD: Safari test on hand was only iPod Touch:

Source: https://habr.com/ru/post/79950/
All Articles