Combining data from the archive of meteorologists with UN data
A couple of weeks ago I published an article about what I found interesting for myself inside the mail archive of meteorologists. In addition to other tips and comments, they pointed out to me a data archive that the UN is distributing and, of course, I could not pass by. In addition, there is, of course, data on temperature. I immediately wanted to combine these data with data on tree rings and see what happens.
Under the cat, as usual, 10 minutes of reading and a lot of graphs, this time there is even a map. Familiarization with the first article is recommended, although not required.
')
So, the database was originally in the form of a heap of mdb-files, which I didn’t want to mess around with. Fortunately, there was some kind of muddy program attached specifically for exporting to csv files. I will omit the problems I encountered while saying that I spent two days on downloading the resulting csv-file, while it seemed to download data from a stolen archive for no more hours
The results produced two tables: the list of stations (with name, country of location, latitude, longitude, elevation, etc.) and the actual temperatures for these stations. The data are given by the average monthly temperature, but I reduced them to the same figure for the year, bearing in mind that I will have to compare all this with the data on annual rings of trees. Surprisingly, data from weather stations are given for a rather long period.
The first thing that comes to mind is to build a graph of the average temperature in the country over the past hundred years. Since the country of meteorological stations was indicated, it did not have to mess with it and the first schedule was built completely without problems. Links from pictures - on themselves.
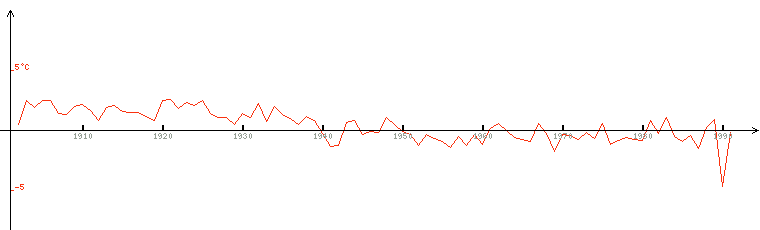
The average annual temperature in the territory of the Russian Federation.
The schedule, of course, is quite dreary, and it is still creeping down. But nothing can be done. In any case, the temperature will be interesting not for the whole year, but only for the months when the trees are actively growing (hereinafter I call it the average temperature over the summer). I decided that this is May-September inclusive, this schedule does not look so depressing, but it also clearly goes down:
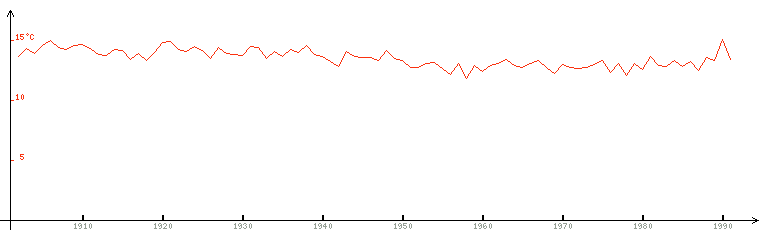
The average summer temperature in the territory of the Russian Federation.
Then I decided on the same graph to display the number of weather stations operating in the corresponding year, they are shown in gray:
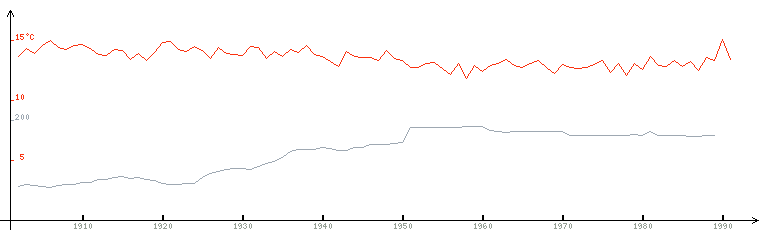
That is, until the 50s, the weather stations were much smaller, and what is more important: their composition changed. I want to pay special attention to this simple fact, because by changing the composition of meteorological stations one can easily resort to any speculation. Not only are we rarely told about the method that was used to obtain data on temperature fluctuations, especially since no one ever talks about the composition, location and change in the composition of data collection points. What for? The viewer is not that interesting. Now we start building weather stations along the southern borders - there will be a warming right away, right next year there will be confirmed results.
But I'm not talking about that, I'm about trees. 50 years of more or less stable composition of meteorological stations should be quite enough to notice the presence or absence of a correlation between the rings of the trees and the temperature, so I was not very upset.
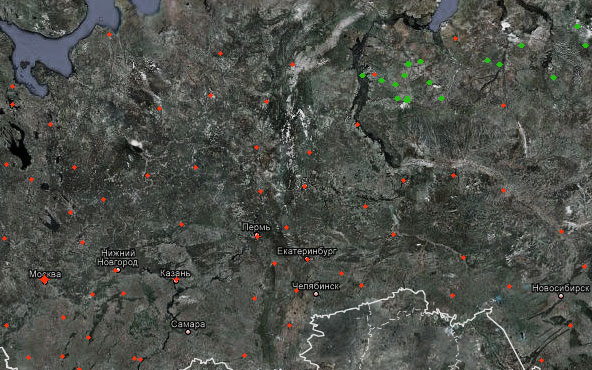
There was one more ... not so much a problem, but complexity. The data on the trees are fairly heaped: with such a strip in a sparsely populated part of Russia. And I just didn’t know how the weather stations were placed, but rather the opposite, along the populated part of the country, so I didn’t really want to compare the average values here and there. It would be good to find such a station, next to which a tree would be cut down. Nothing more worthwhile than simply drawing all the stations and all the trees on the coordinates on a clean sheet did not occur. This is a simple matter, so without hesitation, I took up this. The truth was that we had to load the notorious sib.dat (which contains a list of the 51st tree, just with the coordinates), but that didn’t take much time either.
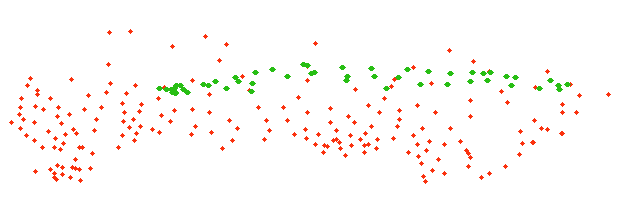
Green spots indicate the places of saw cut trees according to the sib.dat file, red marks the weather stations. In my opinion, it already looks like familiar outlines from childhood. I immediately wanted to put these spots on a real map. The problem is that most of the maps are drawn not in rectangular coordinates, but with distortion ( example ): the meridians in the north of the map are always closer to each other than in the south. I remembered google maps: if you move the map as far as possible, then you get a mosaic of map repetitions, which is similar to the reduction to a rectangular coordinate system.
To bind to a map by position and scale, several points with known coordinates are needed. For this city is quite suitable. Among the weather stations there are located right in major cities, so there will be something to contact. Unfortunately google maps hides cities when the map is reduced, so I had to work with a fairly large scale. I marked Moscow, Perm, Volgograd and Kazan in my drawing, after several manipulations with the scale I managed to combine them with the map.
Under the link full big option.
The error seemed to me quite acceptable, who else knows exactly where these weather stations are located. The result: a big picture (1814x739, 404k), but worth it. The highlighted cities are not so noticeable, but if you look closely, you can clearly see Moscow (bigger) and others. It is interesting to pay attention to the stations on Kamchatka and on the islands near it. It is also clear that there are weather stations in Nizhny Novgorod and Yekaterinburg, but not in Novosibirsk (checked). I think it's too neat for coincidences, so I'm generally pleased.
Three pairs of points are circled in blue circles on the map: these are stations and trees, which I selected to check the dependence of the width of the annual rings and the temperature. The station in the left circle is called “OLENEK” and has coordinates 112.43, 68.5; the tree that was found nearby has coordinates 112.15, 68.36 and is signed “OLE”. For one, the nature of the origin of the strange three-letter tree names has opened: it is, after all, settlements that are not always on the map.
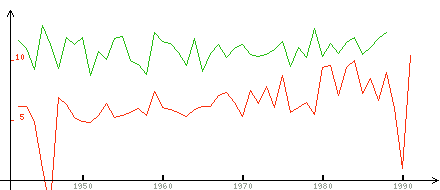
The red line is the average temperature over the summer at the station, the green line is the width of the annual rings of the corresponding tree. What can I say. Yes, there is little that can be said. The graphics are very noisy and not very similar. Temperature anomaly at the beginning of the graph - this was due to the lack of data for the 45th and 46th years. For the 45th there were none at all (displayed as zero), and for the 46th, data was only for September: -3 ° C; Not before the weather, probably after the war was. In 1990, the situation is similar, for some reason there is very little data for this year.
Having some desire, of course, we can consider that after all, as the temperature rises, the graph of the rings also always goes up, or slows down the fall. Almost always, the temperature peaks coincide with the peaks of the graph on the rings, although there are obvious contradictions, for example, in the region of 1970. There may be many reasons for this, I think the main one is that the concentration of CO2, which strongly influences the growth of trees, is not taken into account. To check, I built graphs for two other weather stations noted, the situation there is completely similar. I will give only the average graphs for these three points. By the way, these three, very northern stations, actually began to operate somewhere in the 40th year.

Since this preparation was done, I also built an average schedule for the entire region, which I obtained by cutting off the rectangle in latitude and longitude, so that the weather stations were approximately in the same area as the trees: I controlled this by displaying stations and gathering places. trees.
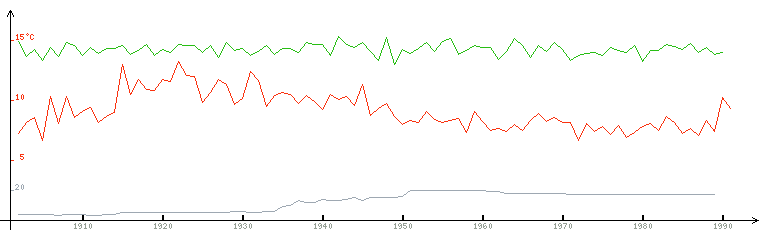
To make it more interesting, built from 1900 onwards, it is noticeable again, as the average temperature drops as the number of weather stations grows, which barely reaches 20. There is nothing special to comment in general, I will not even be offended if someone says that there is no correlation at all: the dependence is clearly even less than in the individual graphs for the three stations.
In the process of writing the article, the idea came up to build temperature charts for these three stations, this picture explains something (the red line is the average).
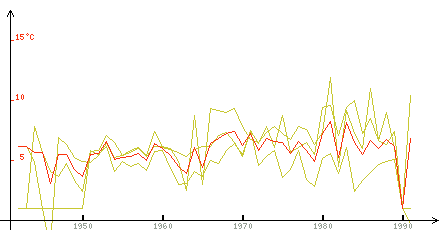
This is not data butpi noise of some kind: stations are too far from each other. In order not to get very upset, I built a similar schedule for other, closely located stations in another part of the country (Sochi, Pyatigorsk, Tuapse):
In general, another thing, the team of Vaganov did not cut trees there.
All sorts of stuff
Instead of conclusion
Again, I want to draw the attention of the community to the opportunity here today and now to look at the raw data yourself, to build some graphics, to draw some, though not claiming the Nobel Prize, but my own conclusions. Well, do not let anyone wonder about the average annual temperature on the planet, without specifying its measurement methods, whether CO2 is taken into account, if it were annual rings of trees, if changes were included in the composition of weather stations, if they were weather stations, etc. Most of the so-called. "Experts" do not know anything about it.
Under the cat, as usual, 10 minutes of reading and a lot of graphs, this time there is even a map. Familiarization with the first article is recommended, although not required.
')
So, the database was originally in the form of a heap of mdb-files, which I didn’t want to mess around with. Fortunately, there was some kind of muddy program attached specifically for exporting to csv files. I will omit the problems I encountered while saying that I spent two days on downloading the resulting csv-file, while it seemed to download data from a stolen archive for no more hours
The results produced two tables: the list of stations (with name, country of location, latitude, longitude, elevation, etc.) and the actual temperatures for these stations. The data are given by the average monthly temperature, but I reduced them to the same figure for the year, bearing in mind that I will have to compare all this with the data on annual rings of trees. Surprisingly, data from weather stations are given for a rather long period.
The first thing that comes to mind is to build a graph of the average temperature in the country over the past hundred years. Since the country of meteorological stations was indicated, it did not have to mess with it and the first schedule was built completely without problems. Links from pictures - on themselves.
The average annual temperature in the territory of the Russian Federation.
The schedule, of course, is quite dreary, and it is still creeping down. But nothing can be done. In any case, the temperature will be interesting not for the whole year, but only for the months when the trees are actively growing (hereinafter I call it the average temperature over the summer). I decided that this is May-September inclusive, this schedule does not look so depressing, but it also clearly goes down:
The average summer temperature in the territory of the Russian Federation.
Then I decided on the same graph to display the number of weather stations operating in the corresponding year, they are shown in gray:
That is, until the 50s, the weather stations were much smaller, and what is more important: their composition changed. I want to pay special attention to this simple fact, because by changing the composition of meteorological stations one can easily resort to any speculation. Not only are we rarely told about the method that was used to obtain data on temperature fluctuations, especially since no one ever talks about the composition, location and change in the composition of data collection points. What for? The viewer is not that interesting. Now we start building weather stations along the southern borders - there will be a warming right away, right next year there will be confirmed results.
But I'm not talking about that, I'm about trees. 50 years of more or less stable composition of meteorological stations should be quite enough to notice the presence or absence of a correlation between the rings of the trees and the temperature, so I was not very upset.
There was one more ... not so much a problem, but complexity. The data on the trees are fairly heaped: with such a strip in a sparsely populated part of Russia. And I just didn’t know how the weather stations were placed, but rather the opposite, along the populated part of the country, so I didn’t really want to compare the average values here and there. It would be good to find such a station, next to which a tree would be cut down. Nothing more worthwhile than simply drawing all the stations and all the trees on the coordinates on a clean sheet did not occur. This is a simple matter, so without hesitation, I took up this. The truth was that we had to load the notorious sib.dat (which contains a list of the 51st tree, just with the coordinates), but that didn’t take much time either.
Green spots indicate the places of saw cut trees according to the sib.dat file, red marks the weather stations. In my opinion, it already looks like familiar outlines from childhood. I immediately wanted to put these spots on a real map. The problem is that most of the maps are drawn not in rectangular coordinates, but with distortion ( example ): the meridians in the north of the map are always closer to each other than in the south. I remembered google maps: if you move the map as far as possible, then you get a mosaic of map repetitions, which is similar to the reduction to a rectangular coordinate system.
To bind to a map by position and scale, several points with known coordinates are needed. For this city is quite suitable. Among the weather stations there are located right in major cities, so there will be something to contact. Unfortunately google maps hides cities when the map is reduced, so I had to work with a fairly large scale. I marked Moscow, Perm, Volgograd and Kazan in my drawing, after several manipulations with the scale I managed to combine them with the map.
Under the link full big option.
The error seemed to me quite acceptable, who else knows exactly where these weather stations are located. The result: a big picture (1814x739, 404k), but worth it. The highlighted cities are not so noticeable, but if you look closely, you can clearly see Moscow (bigger) and others. It is interesting to pay attention to the stations on Kamchatka and on the islands near it. It is also clear that there are weather stations in Nizhny Novgorod and Yekaterinburg, but not in Novosibirsk (checked). I think it's too neat for coincidences, so I'm generally pleased.
Three pairs of points are circled in blue circles on the map: these are stations and trees, which I selected to check the dependence of the width of the annual rings and the temperature. The station in the left circle is called “OLENEK” and has coordinates 112.43, 68.5; the tree that was found nearby has coordinates 112.15, 68.36 and is signed “OLE”. For one, the nature of the origin of the strange three-letter tree names has opened: it is, after all, settlements that are not always on the map.
The red line is the average temperature over the summer at the station, the green line is the width of the annual rings of the corresponding tree. What can I say. Yes, there is little that can be said. The graphics are very noisy and not very similar. Temperature anomaly at the beginning of the graph - this was due to the lack of data for the 45th and 46th years. For the 45th there were none at all (displayed as zero), and for the 46th, data was only for September: -3 ° C; Not before the weather, probably after the war was. In 1990, the situation is similar, for some reason there is very little data for this year.
Having some desire, of course, we can consider that after all, as the temperature rises, the graph of the rings also always goes up, or slows down the fall. Almost always, the temperature peaks coincide with the peaks of the graph on the rings, although there are obvious contradictions, for example, in the region of 1970. There may be many reasons for this, I think the main one is that the concentration of CO2, which strongly influences the growth of trees, is not taken into account. To check, I built graphs for two other weather stations noted, the situation there is completely similar. I will give only the average graphs for these three points. By the way, these three, very northern stations, actually began to operate somewhere in the 40th year.
Since this preparation was done, I also built an average schedule for the entire region, which I obtained by cutting off the rectangle in latitude and longitude, so that the weather stations were approximately in the same area as the trees: I controlled this by displaying stations and gathering places. trees.
To make it more interesting, built from 1900 onwards, it is noticeable again, as the average temperature drops as the number of weather stations grows, which barely reaches 20. There is nothing special to comment in general, I will not even be offended if someone says that there is no correlation at all: the dependence is clearly even less than in the individual graphs for the three stations.
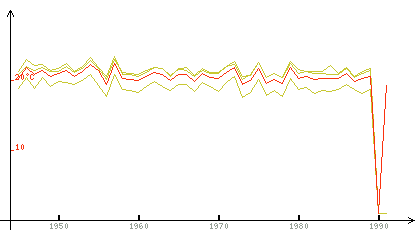
In the process of writing the article, the idea came up to build temperature charts for these three stations, this picture explains something (the red line is the average).
This is not data but
In general, another thing, the team of Vaganov did not cut trees there.
All sorts of stuff
- I took the data here .
- It turns out regular weather observations have been documented since the 1800th year. The first to monitor the temperature began in Austria, Britain, Hungary, Germany, Denmark, and next to it.
- In Russia, regular observations take place since 1850, and they began immediately in 14 cities immediately.
- 5988 meteorological stations were downloaded in 203 countries, the total number of temperature records: 3.8 million. 156 thousand records, 206 meteorological stations were loaded in Russia. Directly loading itself lasted 59 minutes 19 seconds.
- Besides that, there are data available right through summer 2009 , but, damn, as much as pdf-files, the Earth is full of talents, well, not bmp.
Instead of conclusion
Again, I want to draw the attention of the community to the opportunity here today and now to look at the raw data yourself, to build some graphics, to draw some, though not claiming the Nobel Prize, but my own conclusions. Well, do not let anyone wonder about the average annual temperature on the planet, without specifying its measurement methods, whether CO2 is taken into account, if it were annual rings of trees, if changes were included in the composition of weather stations, if they were weather stations, etc. Most of the so-called. "Experts" do not know anything about it.
Source: https://habr.com/ru/post/79605/
All Articles