Fighting the load on DiPHOST.Ru. Success story

Load and resources as it is.
A year ago, I did a tedious report on the load, it can be found here: http://vimeo.com/7631344 .
Briefly outline the main provisions of it:
- According to the strategy of providing resources can be guaranteed and shared. There is no holivar between them - they are either such or such. With its own features.
- Resources must be divided by functionality. The more fully separated the individual services in terms of functioning, the easier it is to cope with the control of resources. With the "bunch" is always harder to figure out.
- Shared resources should work at full performance. You can not "slow down" resource. It is required to choose the “entry point” optimally and limit it and only it.
Problem.
In our case, we are considering virtual UNIX hosting with shared resources. Those. many different sites on the same server or server group.

One of the most striking problems of virtual hosting is the uncontrolled attendance that cannot be reasonably formalized, in particular its sharp jumps. The result is a periodic explosive growth of connections to the web server, the resulting load on the database and / or disk, slowing down the results for the sum of reasons. Feedback - the growth of connections to the web server due to slowing down processing.
This happens in 90% of cases due to the fault of various robots, both “white” (Yandex, Google and so on), and “gray” (other indexing services - sape, linkfeed and the like) and even (oh my God!) “Black "- robots that steal content. “Black robots” usually try to pull off content “at a time,” so they come to the site in dozens of simultaneous streams, which create considerable problems.
The situation is almost always aggravated by the fact that the queue of people who want to get to the web server at the time of the influx of connections to some site is growing. Even when the “culprit” subsides, the accumulated “queue” sharply tries to fill the vacated resources. This leads to the so-called "swell". In my practice, there were often problem cases even with respect to one server - three sites.
')
Installing a thin proxy (for example, nginx) in front of a web server eliminates a number of symptoms of the problem. The problem itself remains.
Moving the database to a separate machine reduces the order of the negative effect, but does not eliminate it, and is not economically justified in all cases.
There is a caching option for site pages. But let’s be realistic - most developers don’t know anything about the execution environment of their development, they don’t want to and never will. At about the fifth site you will already forget that it is being cached, that it is never cached, who just changed the structure of the site or something else.
Theory.
Obviously, in the described situation, the “entry point” is the connection to the web server, and it is necessary to limit it. The question immediately arises - what do we want to “say” to the incoming “extra” connection? If we “say” to him at least something, whether it is an error 503 or a connection reset, we will eventually have “broken” websites with an unspecified number of visitors in a chaotic order. From ready-made solutions, we have only limit_req in nginx with high burst. But there is a problem - how to choose the query speed parameter? You can, of course, modify limit_conn, to the burst parameter from limit_req. But both solutions have a problem - the entry point to the “thin proxy” is limited.
In our opinion, the “thin proxy” entry point is not the best place to restrict. At the same solutions for the same apache problem is common - they are something, but return. Revision is impossible even theoretically - not to keep the Apache handler awaiting “permission”, this negates the whole point of the idea.
Prehistory
We provide a hosting service for python applications via mod_wsgi. Apache runs for each site a number of special handlers that are constantly in memory. Imagine our surprise when we realized that we didn’t notice the “influx” effect on such sites (for example, http://twihoo.ru , which is quite large in attendance, but not the largest in server load!).
Looked closer. Obviously, Apache communicates with handlers on a unix-socket, and all the “extra” connections just wait for them to be processed. The result is a "smearing" of the load over time without unnecessary gestures. This practice has greatly reduced our religious fear of constantly residing user processes, and we began to look for a solution.
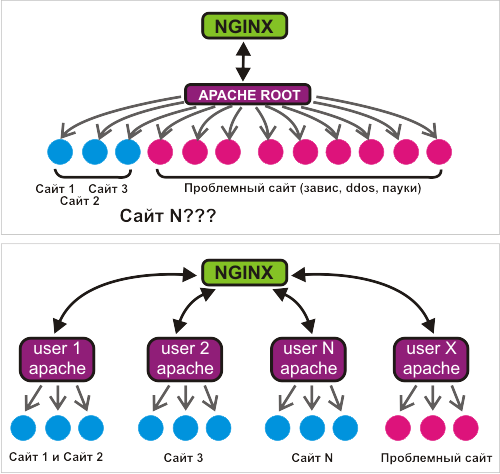
Eureka!
The decision came quite unexpectedly. I participated in setting up the server to our partners and wanted to put them on several separately configured apache web servers. Looking into the apache startup script from the FreeBSD package collection, I suddenly found that there was such an option out of the box. Sites with partners promoted, visited, heavy. Partners are demanding and completely depend on the quality of work sites. Given our experience hosting the WSGI, the temptation to conduct an experiment "in battle" won.
“Everyone has his own apache” turned out to be a very good idea. Most recently, the FreeBSD scheduler depended on the number of processes (default to version 7.1), but we, as a progressive company, have already used new versions of FreeBSD with a new scheduler. The experiment showed that with the availability of resources, 3-4 Apache processes withstand fairly large attendance of even “heavy” sites. Such a solution has a number of obvious advantages over specialized solutions like mod_peruser and mod_itk - the lack of vaguely working code of these modules, the ability to control the number of Apache modules, the ability to make specialized settings for these modules.
So far, we have used apache 1.3.x for hosting with a slightly modified Dmitry Koterov’s very first patch - apformat made vfork () for each request, then setgid () and setuid (), after serving the request - _exit (). A new way gives us the opportunity to save processor time spent on these procedures.
But there is also a minus - requirements for the amount of memory permanently occupied. Modern virtual memory machines, especially those inherited from the mach OS, are very complex. It is not possible to count and even estimate in advance how much physical memory will be actually used.
By the way, a similar scheme of dedicated web servers is used by some Russian and some foreign hosting providers. For example: MediaTemple with the GridContainers service ( http://mediatemple.net/webhosting/gs/features/containers.php ). The truth is somewhat more complicated with virtualization, but the general idea is similar.
Through hardship to the stars.
We made a willful decision to take a chance . For a whole month, we wrote a program for assembling configurations according to the panel, responding to changes, starting and stopping a web server, automatically tracking the status of each of the hundreds of running web accounts, rotating the logs, and changing the configuration of a thin proxy - nginx. At the same time, we combed and optimized all nodes involved in the restructuring.
The first failure awaited us with ... php. We tried to build php 5.2.x statically with an apache to reduce the time it takes to start the web server and, theoretically, the costs during execution. Unfortunately, without tricky edits within the php build system, this was not possible. Time did not allow to adequately correct it, and we had to temporarily abandon the venture. By the way, if there is a wish, this problem is described in LiveJournal, you can try to solve it with suitable methods: community.livejournal.com/ru_root/1884339.html .
But finally the system is prepared. We transferred several "our" sites to it. The result inspired - three Apache handlers were more than enough for a heavy drupal site with ~ 1200 unique traffic. As a special test, we tried a small “dos-attack” on this site (10,000 requests for 100 simultaneous requests) - the site slowed down but had almost no effect on the work of other sites. We did not diagnose any significant changes in the distribution of memory. Our hosting site, which we also transferred to the new system, did not appear at all in the top output. And so, for three nights I happily transferred all the other servers to the new system. Why at night? Because at night servers are usually empty, and due to this, all modifications are done most quickly and imperceptibly.
Monday morning came ...
Complete failure.
The server with the smallest number of sites began to work noticeably better, but much slower. On the server with the i386 architecture, the OS was not diagnosed with a lack of memory, but suddenly mysql took all the disk access and almost paralyzed it. The most powerful server made a gigabyte swap and also almost paralyzed the disks.
Such a state of "overloaded" server has its advantages. Stressful situations generally contribute to mental work. We immediately captured all those who create temporary tables in mysql for hundreds of megabytes, we caught several sites that made several hundred database updates per second. We completely put in order all the mysql server settings. At the same time, they corrected the mytop utility for themselves, which had never been reached before : schors.livejournal.com/652161.html . But nothing gave a tangible improvement. In a burst of light panic, we tried to make large buffers for recording Apache logs - a buffer for frequent recordings is generally useful. Practice has shown zero results under the circumstances.
By the end of the day, we were ready to give a cue to roll back just the whole. But rollback is the surrender of positions, because we did not understand what was happening. This means that the new system and the solution of the problem will not appear soon. We have a little more time. Almost a day was spent on a full system diagnostics and resuscitation of all possible manuals and manuals.
The results in theory turned out to be banal - still not enough memory. Not all memory wants to be in a disk swap, not all programs with a lack of memory report this (for example, mysql with temporary tables and caches), using other tools. Considering the cost of additional RAM, we decided not to hesitate to upgrade the equipment. And they guessed it.
A double increase in memory has solved everything. I want to note that all this looks strange afterwards - initially it was clear that there might not be enough memory. But everything was unclear. Anything could not be enough - the scheduler could not cope, the processor could not cope, no memory could be enough at all, apache handlers might not be enough, buffers could not be enough, there might not be enough disk. In general, the last and confused us. Instead of conducting a direct relationship between memory utilization and disk activity, we rushed to solve the problem of “what loads the disk so much”, despite what programs do with it.
And then suddenly in the back hit us ... php. Collected by statics php 5.2.11 suddenly refused to work normally with the gd module (graphics). Moreover, he refused to work at all on the library section we had. With magical methods for a sleepless night, we managed to bring into operation only php with dynamically loaded extensions. This problem is as follows: www.google.com/#hl=en&newwindow=1&q=gd-png+fatal+libpng+error+freebsd+imagecreatefrompng&lr=&aq=f&oq=&fp=7b635a504e075d30 . It was not possible to understand what dependence this happens on. The problem is open.
On the way to world domination.
The result was amazing. We equalized the load. We present an illustrative chart in the "parrots" Load Average. In the area of the 44th week, you can clearly see a suddenly flattened 15-minute load (the “hills” have smoothed out), which predictably fell at the end of the week with the equipment upgrade.

We won the CPU time by dropping the vfork () constant. The graph shows that the use of cpu fell noticeably at the beginning of the 44th week, after the equipment upgrade at the end of the week, the changes are less noticeable.

There is only one question left - have we not overdone with the restriction of three apache web server handlers per user? On average in the hospital, each user places two sites. But some often have ten. We are closely following our monitoring reports. For every apache running, we have to check the connection with a timeout of 60 seconds. So we determine that the site is exactly "laid down". It's been two weeks. The activation of the monitoring is calculated in single cases. Which is typical - literally three of the hundreds of clients. This usually happens either from non-standard floods of those who want to “swing” something, or sometimes during database backup, or from errors made during the site update process.
The new system brought us pleasant surprises. We got an "honest top". The top program shows the processes in the system, by default sorting them by some strange parameter - the percentage of processor usage. It is calculated on a fixed time interval by the kernel according to a rather tricky estimation algorithm and in fact is not a percentage in its pure form. In the case when a single web server process can handle connections to sites of different users, we see a “residual” percentage of the past use of the process. In the case when we do vfork (), we generally see only those processes that have time to get into the survey. In the new system, this obviously does not happen. Those processes that appear at the top of the top are truly the most demanding of resources.
So, stepping over the subconscious fear of the new, remaking a little less than the fully functional hosting architecture, we got rid of the “Monday effect”.
Source: https://habr.com/ru/post/75386/
All Articles