XDebug - if you are tired of echo (), var_dump () and print_r () when debugging. Part 1.
XDebug is a powerful debugging extension for PHP scripts written by Norwegian Derick Retans (Derick Rethans, www.derickrethans.nl , project leader for the eZ components ). Works on both Windows and Linux, supports PHP 4.4.1+, PHP 5.1.2+, PHP 5.2.1+.
This extension provides the following information:
- stack of function calls
- memory allocation
- profiling
- etc.
XDebug, in the first place, is a good and easy to install profiler that helps the developer to find bottlenecks in the code, determine which parts of your code are slow: queries to the database, connection of files, parsing something, etc.
Profiling (from profiling. English) - an estimate of the execution time of the code.
Currently, there are two versions of the profiler: XDebug and XDebug2. They differ in the profile-log format and the wealth of settings. The first version is simpler, the settings are small, the format of the log is readable.
')
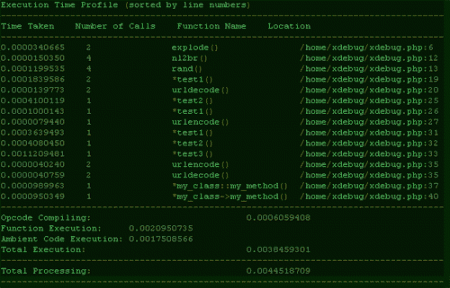
Example profile log for XDebug (version 1):

Log format :
- Time Taken (Runtime)
- Number of Calls (number of function calls)
- Function Name (function name)
- Location (location with line number)
- Total Time (total lead time)
There are also 8 profiling modes. I will not describe, you can see here .
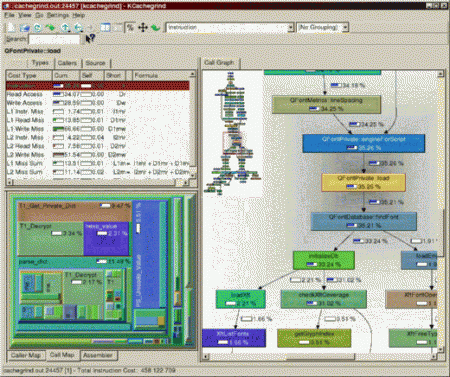
XDebug2 is in my opinion more interesting, as it allows you to view the profile log using special utilities: WinCacheGrind (for Windows) and KCacheGrind (for Linux).

KCacheGrind is a more powerful utility that allows you to visualize the results.

All profiler settings can be divided into several sections:
- basic settings (GENERAL SETTINGS)
- output settings (DISPLAY SETTINGS)
- TRACING SETTINGS settings
- remote debugging settings (REMOTE DEBUGGER SETTINGS)
- profiling settings (PROFILER SETTINGS)
- settings for dumping global variables (SUPERGLOBAL DUMPING SETTINGS)
PS: I strongly advise everyone to read an interview with Derik Retans in PHPArchitect magazine (September 2004) [pdf, 910Kb]
This extension provides the following information:
- stack of function calls
- memory allocation
- profiling
- etc.
XDebug, in the first place, is a good and easy to install profiler that helps the developer to find bottlenecks in the code, determine which parts of your code are slow: queries to the database, connection of files, parsing something, etc.
Profiling (from profiling. English) - an estimate of the execution time of the code.
Currently, there are two versions of the profiler: XDebug and XDebug2. They differ in the profile-log format and the wealth of settings. The first version is simpler, the settings are small, the format of the log is readable.
')
Example profile log for XDebug (version 1):

Log format :
- Time Taken (Runtime)
- Number of Calls (number of function calls)
- Function Name (function name)
- Location (location with line number)
- Total Time (total lead time)
There are also 8 profiling modes. I will not describe, you can see here .
XDebug2 is in my opinion more interesting, as it allows you to view the profile log using special utilities: WinCacheGrind (for Windows) and KCacheGrind (for Linux).

KCacheGrind is a more powerful utility that allows you to visualize the results.

All profiler settings can be divided into several sections:
- basic settings (GENERAL SETTINGS)
- output settings (DISPLAY SETTINGS)
- TRACING SETTINGS settings
- remote debugging settings (REMOTE DEBUGGER SETTINGS)
- profiling settings (PROFILER SETTINGS)
- settings for dumping global variables (SUPERGLOBAL DUMPING SETTINGS)
PS: I strongly advise everyone to read an interview with Derik Retans in PHPArchitect magazine (September 2004) [pdf, 910Kb]
Source: https://habr.com/ru/post/7354/
All Articles