Overview of the library for interactive data visualization WPF DynamicDataDisplay
Hello, dear users!
In this post I will tell you about our development - a free open-source library for interactive data visualization WPF DynamicDataDisplay .
A little about us: we are employees of the Microsoft technology laboratory at the Faculty of Computational Mathematics and Cybernetics of Moscow State University. Recently on Habré there was an article about how our faculty is seen by a first-year student, and now this post will allow you to know a little more about what our faculty students are doing at more advanced courses. An example of what fifth-year students are working on is our library for the interactive visualization of scientific data DynamicDataDisplay (abbreviated D3).
A bit of history
Library development began in September 2007 as part of the collaboration between our laboratory and Microsoft Research Cambridge. In the summer of 2008, the first version of the library was published on dynamicdatadisplay.codeplex.com , where it remains and is still being developed. Since the publication, 3 more releases of the stable version of the library have passed. Now the next version is being prepared for release - presumably v0.4, which will contain a lot of changes and innovations.
But enough introductory words - what is DynamicDataDisplay for the library and what are its capabilities?
')
DynamicDataDisplay features
DynamicDataDisplay is designed for use in managed-applications built on WPF or Silverlight technologies (more on this later).
You can say that there are already enough .NET libraries for drawing graphs, and here I agree with you - there really is an amount . But the quality often leaves much to be desired - ask such a component to construct a graph based on data of several tens of thousands, and already on several hundreds of elements you will feel a significant slowdown.
The main advantages of DynamicDataDisplay over their counterparts are the focus on interactive display of large amounts of data, free of charge, the availability of open source code. The interactive display of large volumes of data means that you will receive not a static image of your information, but a live graph, with the ability to move around it, bring closer individual areas and move away from them. DynamicDataDisplay features a modular and flexible architecture that allows you to easily modify and complement it to fit your needs.
So, what can show DynamicDataDisplay:
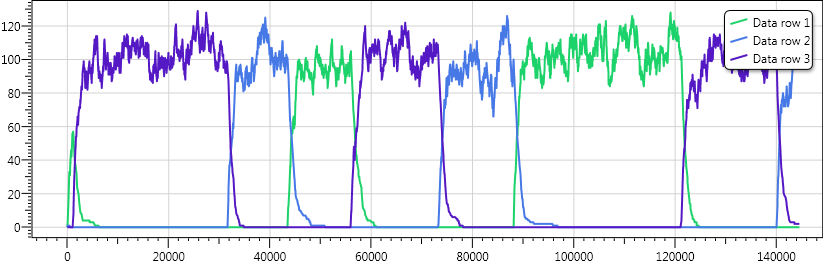
- Lines - graphics:
- A sequence of markers — small visual elements associated with the data. At the marker level there is support for DataBinding, and you can specify more complex relationships between the data and the appearance of the marker from the C # code.

Various inline markers: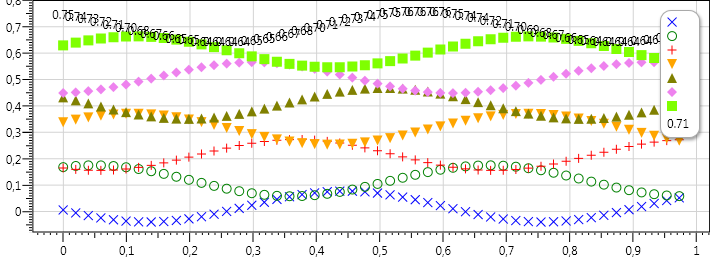
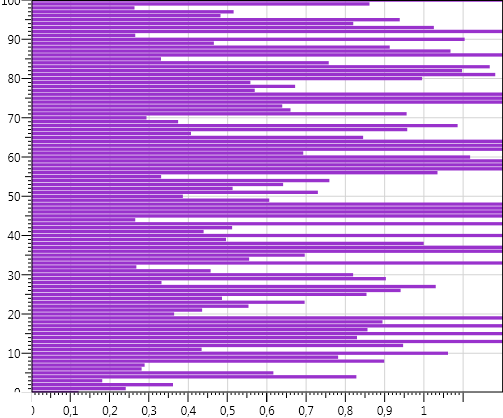
Various bar charts: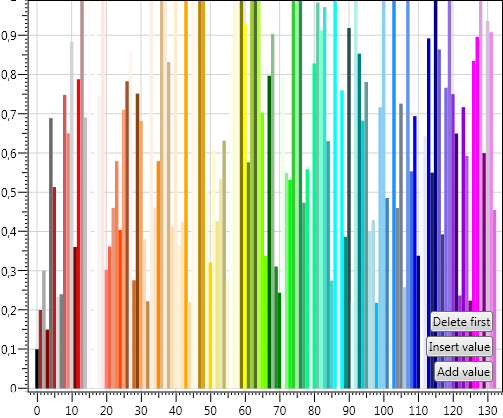
- The most diverse type of axis is the usual numeric, temporary two types (type DateTime and type TimeSpan) and others. The following figure clearly illustrates the tumult of possible axes that I can attend alongside the graph:
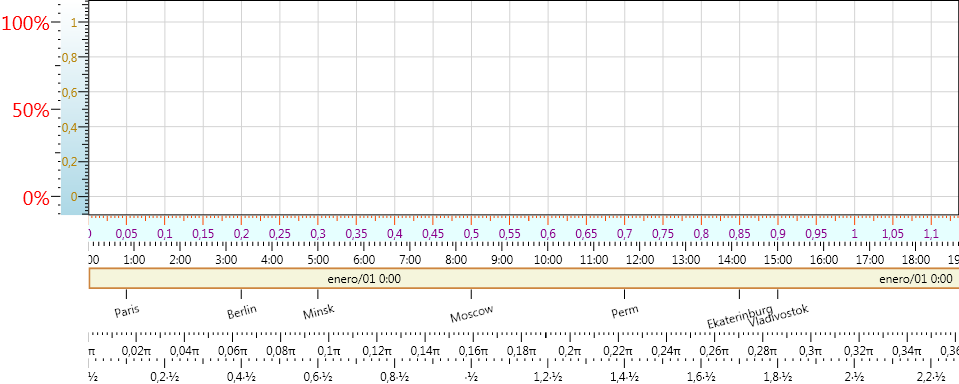
As you can see, we do not have a fixed number of predefined axes, which gives the library user unlimited freedom in finding the best set of axes.
The next big section of the D3 features is
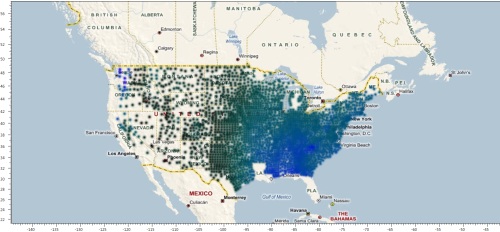
Cards
DynamicDataDisplay can download from the Internet, save to a hard disk and, of course, show all kinds of maps. In the official releases of D3, we have only one map provider, OpenStreetMaps, a free and free map server, which we received permission to release its provider in the D3 package. The fact is that the DynamicDataDisplay component is laid out on the Internet on behalf of Microsoft, which imposes a number of restrictions on those ready-made map providers, which we could put together with the component — we cannot, on behalf of Microsoft, hack Google or Yahoo, Yandex or Mail.ru, or Microsoft itself (Bing Maps). However, it’s pretty easy to write such a provider yourself - I’ll give an example of the non-working code of the Google Sky map provider:
public sealed class GoogleSkyServer: NetworkTileServer
{
public GoogleSkyServer ()
{
UriFormat = "XXX.google.com/mw-planetary/sky/XXX.jpg";
ServerName = "Google Sky";
ServersNum = 2;
MinServer = 1;
FileExtension = ".jpg";
}
protected override string CreateRequestUriCore (TileIndex index)
{
var level = (int) index.Level;
var y = MapTileProvider.GetSideTilesCount (level) / 2 - index.Y - 1;
var x = MapTileProvider.GetSideTilesCount (level) / 2 + index.X;
string uri = String.Format (UriFormat, CurrentServer, x, y, level);
return uri;
}
}
(The example is made non-working specifically, to avoid.)
This is how the OpenStreetMaps maps look the most distant:
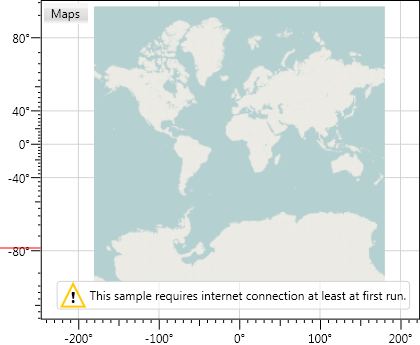
As you can see, the vertical axis contains samples that are non-linearly distributed — this is because the latitude is distributed in the source maps. Therefore, we apply the Mercator transformation to the data displayed above the map so that they are exactly where they should be.
And this is how the map looks like, to which the nonlinear Mercator transform itself is applied, which is done with the shader effect:

There is no need to apply any transformation to the data that are superimposed on this map, since both axes - latitudes and longitudes - are linear.
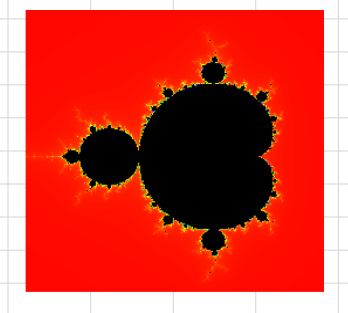
We have developed quite a lot of other visualizations based on maps: for example, this is the Mandelbrot fractal, which as it approaches it calculates additional tiles of the map, which are then added to the pyramid of tiles (the pyramid of tiles is a tree of tiles, ordered by the level of scale. At the first level, say, there should be one image, on the second - 4, 3 - 16, etc.):
Loaded map tiles can be packaged in a zip archive (WPF package, the same as used in docx, xlsx, xps document formats) and then distributed in a more convenient form, working as a preloaded tile cache.
Isolines
DynamicDataDisplay can draw level or contour lines, and on an arbitrary, even curved, grid:
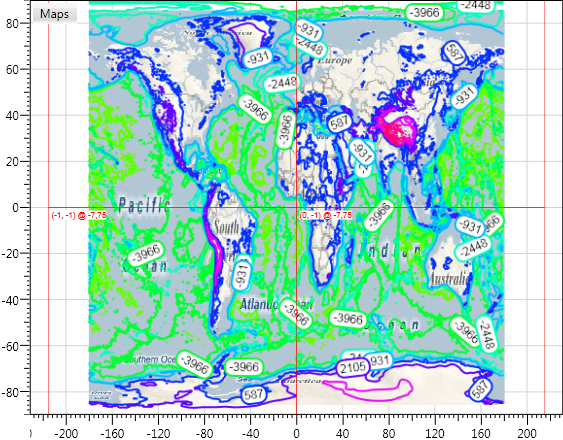
This image shows the level lines of the heights and depths of the Earth. The contour lines themselves are quite voluminous and, being drawn with WPF tools, slow down quite noticeably. To speed up their display, we apply the rendering of the image of the isolines to bitmaps, which are then drawn by the map forces. It turns out very quickly.
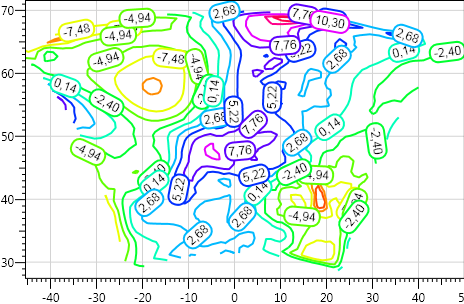
This is what contours look like, drawn by themselves, without intermediate saving to the bitmap:
Prospects for the development of DynamicDataDisplay
In the future, we plan to develop DynamicDataDisplay so that it
Here are some innovations that are either already under development or are about to be developed soon:
- color cards
- 3D visualizations:
- level surfaces
- mesh
- markers in three-dimensional space
- maps from DeepZoom
And finally, a set of links to everything related to our library:
useful links
- WPF DynamicDataDisplay library page - dynamicdatadisplay.codeplex.com
- Twit Library - twitter.com/DynamicDataDisp
- Poll on using DynamicDataDisplay and proposing new features - microsoft.cs.msu.su/Projects/Pages/D3Poll.aspx
- Minor DinamicDataDisplay Wiki - microsoft.cs.msu.su/personal/thecentury/Public%20Documents/Wiki/D3.html
- Stable WPF library version - dynamicdatadisplay.codeplex.com/Release/ProjectReleases.aspx?ReleaseId=26761
- Examples of using WPF version (XBAP application) - mstlab.org/xbap/d3/DynamicDataDisplay.Xbap.Samples.xbap For this demo to work, you need to install Microsoft Parallel Extensions to .NET Framework 3.5, June 2008 Community Technology Preview ( http: // www.microsoft.com/downloads/details.aspx?FamilyId=348F73FD-593D-4B3C-B055-694C50D2B0F3&displaylang=en ) because we use it in some parts of the library
- Stable Silverlight version - dynamicdatadisplay.codeplex.com/Release/ProjectReleases.aspx?ReleaseId=31046
- Examples of using Silverlight version - dynamicdatadisplay.codeplex.com/wikipage?title=DynamicDataDisplay%20Silverlight
- The newest versions of the library are dynamicdatadisplay.codeplex.com/SourceControl/ListDownloadableCommits.aspx
At the moment, the library is fairly well known outside of Russia, judging by, for example, statistics from codeplex.com. Several commercial projects successfully use the DynamicDataDisplay library. The purpose of this article is to increase the popularity of the library in Russia.
That's all for now, I hope you find our library useful and can easily and successfully use it in your projects!
Source: https://habr.com/ru/post/73435/
All Articles