Zabbix Universal Monitoring System - Introduction
 In any network where there is more than one server, it is very useful to have a complete picture of what is happening before your eyes. In large networks, where the number of hosts exceeds several dozens, it is impossible for administrators to monitor each one individually. To facilitate the task of monitoring, monitoring systems are used, and I will talk about one of them, which not a single full article is devoted to Habré.
And so, meet: Zabbix . The system consists of several parts, and with a large load and monitoring a very large number of hosts allows you to split these parts into several separate machines.
Zabbix consists of
- monitoring server itself, which performs periodic data acquisition, processing, analysis and launch of alert scripts
- databases (MySQL, PostgreSQL, SQLite or Oracle)
- PHP web interface
- agent - daemon that runs on monitored objects and provides data to the server. The agent is optional, monitoring can be performed not only using it, but also via SNMP (versions 1, 2, 3), running external scripts that produce data, and several types of predefined built-in checks, such as ping, http, ssh, ftp request and other protocols, as well as measuring the response time of these services.
')
As part of the introductory article, you should talk about which network model is used in Zabbix in order to better understand what is happening and get an idea of the system's capabilities.
The basic logical unit is the Network nodes (host), the servers being monitored. Each server is assigned a description and address (dns or ip, you can both, and with the ability to choose what to use to connect).
Nodes are merged into groups , such as a web server or a database server. Groups are used to display only certain servers under observation.
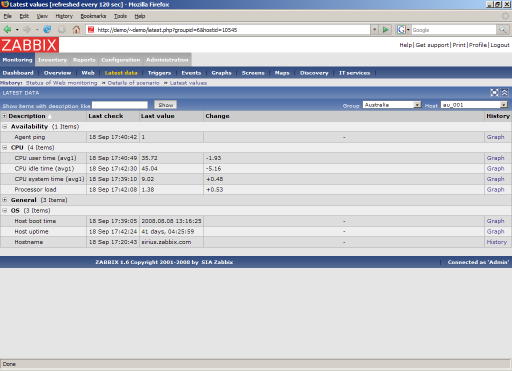
Each node has several Data Items (items) - parameters that are being monitored. For example, on all servers I have the ping parameter, (it is obtained using the built-in check), which equals 1 if the answer to the last ping request was received, otherwise 0. And on one of the servers I have the parameter “number of users online ”, which is compiled by a self-written script from the site’s database. For each data item, you can specify your update period, storage method (the parameter itself or its rate of change), multiplier, collection time interval (for example, only during working hours).
Creating data items for each of the multiple servers is difficult, so you can create template nodes. These nodes also contain data elements, but they are not monitored directly. Instead, the real host is associated with one or more templates, and all template parameters are automatically inherited by the host. So, the ping element is stored in my template, and I simply associate all the hosts with the template_ping template.
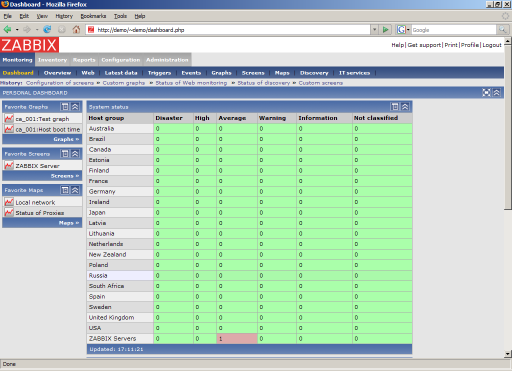
A person is not a robot, and it’s simply unrealistic to keep track of thousands of parameters and think whether this value is beyond the acceptable limits. But even here, Zabbix provides flexible options for setting up trigger conditions that turn on in case of accidents and malfunctions, and the system starts to blink lights (actually red squares) and struggles to show the administrator that something has happened. By the way, when the trigger is turned on, the web interface even starts to squeak in the manner of an alarm clock, probably to wake the observers who have fallen asleep on the keyboard. :) So the speakers here probably won't interfere. And in my template_ping mentioned above, there is a trigger that responds to the lack of ping for more than two minutes.
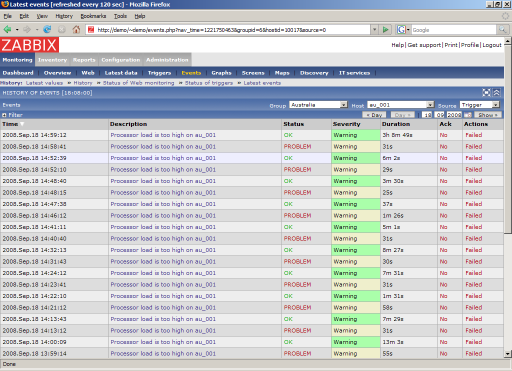
And if the administrator is not there? Nothing, Zabbix is sufficiently independent and will be able to send a notification by mail, to jabber or sms using a gsm modem, or even try to pick up a dropped service on your own by performing predefined actions that are triggered when certain triggers are triggered.

Is it boring to sit and peer at squares and endlessly running numbers? According to any parameter, the system will be able to plot changes, and not at predetermined and rigidly specified time intervals (remember mrtg / rrdtool: daily, weekly, monthly, yearly), but for any time interval with maximum resolution. Want to see in detail how the load on the server changed during the habra effect a month ago? Please, schedule with a resolution of 30 seconds (this is the default polling interval) is at your service. Want a big picture? Select a month interval and look at the average value, and the variation of oscillations to the maximum and minimum. Compare? You can create complex graphs that display several parameters in one field, and you will immediately see that the peak values of the Load Average correspond to the peaks of the traffic.

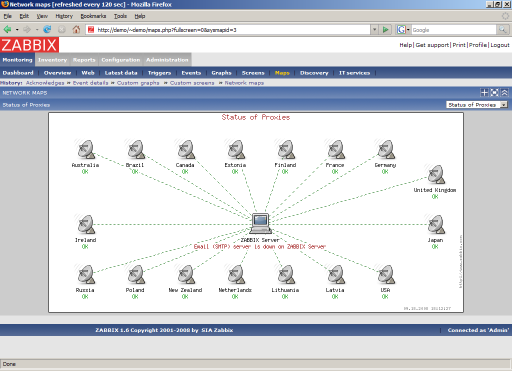
To display the logical structure of the network, you can create a network map that displays the location of network nodes and the connections between them. Naturally, the status of nodes (available or not) is displayed on the map.
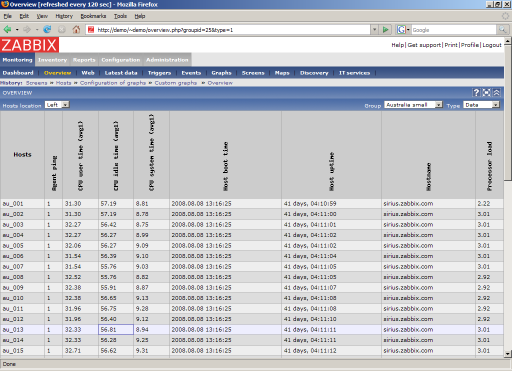
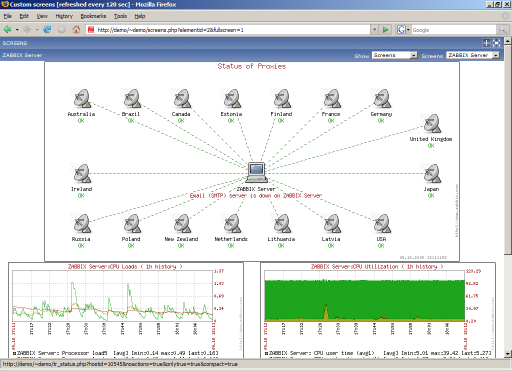
In addition, for a more convenient overview, there are comprehensive reports that allow you to view several entities at once on the same screen - graphs, data, triggers ...
Zabbix is a fairly powerful and extensive system, and it still has half a dozen functions to reserve, which makes it even easier to monitor the network, such as monitoring the status of a website using automatic script execution like “log in, see new messages and exit”, but I haven't even touched them yet.
Screenshots are from the official Zabbix website, and the rest can be seen there (and there are a lot of them) - http://www.zabbix.com/screenshots.php
In the near future - how to use Zabbix instead of Nagios and MRTG and recommendations on migration to Zabbix from these two systems and a comparison of advantages and disadvantages; about writing my own alert and data collection scripts, about my personal experience using Zabbix in production, and about anything else that I will learn in the process of further studying this wonderful system.
Source: https://habr.com/ru/post/73338/
All Articles