VS 2010: Debugging with IntelliTrace
 One of the most talked about innovations in Visual Studio VS 2010 is IntelliTrace, which allows the developer to record the execution of the application and “flush back”. Using IntelliTrace, can do interesting things, for example, a step back when debugging.
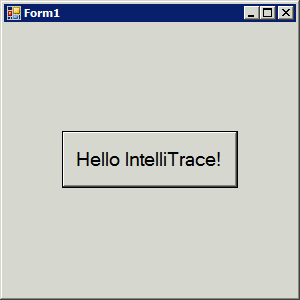
Let's start with “Hello World!” For your reference. We will create a simple Windows Forms project and try to use various IntelliTrace features.
')
Add one line to the button event handler:
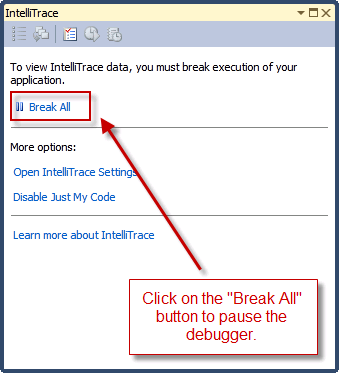
Debug.WriteLine( "Hello IntelliTrace!" )Run the application in debug mode and click on the button. On the right side of the Visual Studio window, you should see a new IntelliTrace window, as shown below. Click Break All in the window that appears.
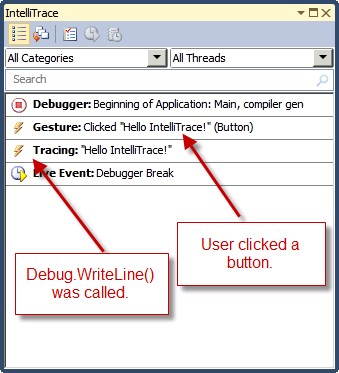
After clicking on Break All, the IntelliTrace window will display a list of useful “events” as shown below. IntelliTrace records what happens in your application in chronological order. Therefore, by reading the list in the IntelliTrace window, you understand what is happening:
- The application is running in debug mode.
- User clicked on the “Hello IntelliTrace!” Button
- The application has output some tracing information. Debug.WriteLine ()
- Application suspended in debugger
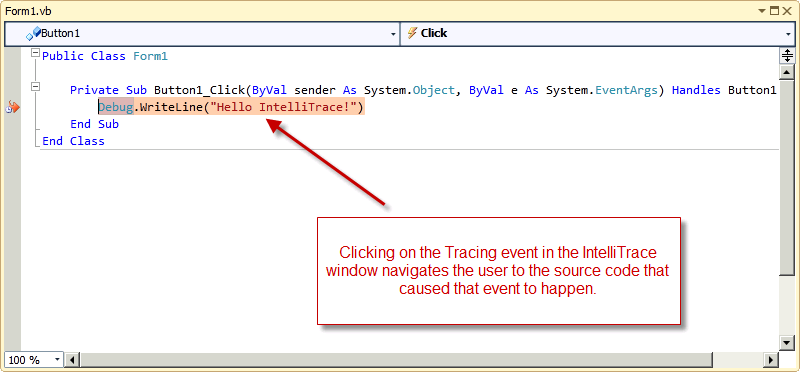
If you click on an event in the list, then move to the place in the code that caused it.
Step back when debugging
This feature is disabled by default. In order to activate it, go to Tools-> Options-> IntelliTrace and select “IntelliTrace events and call information”, as shown below.

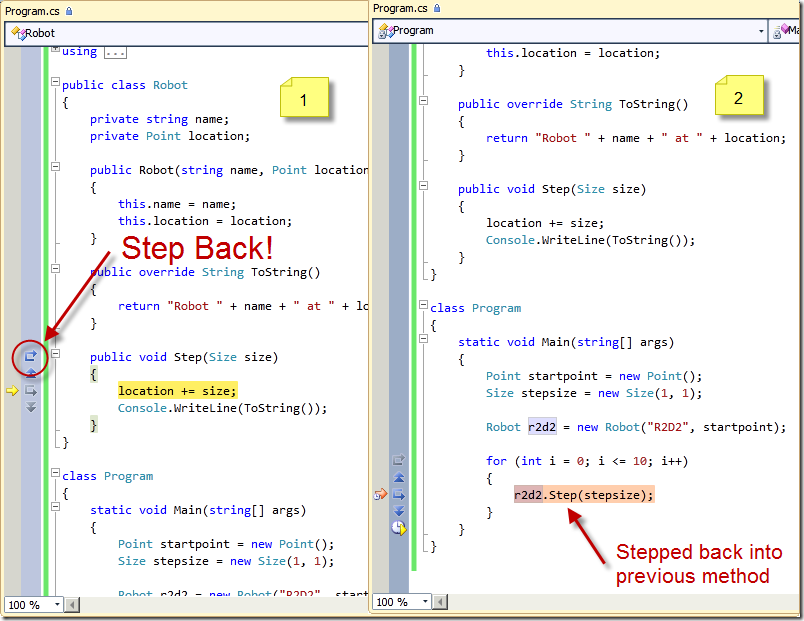
In the following screenshot, you can see what happens before and after a step back. In the left part, the “Step back” button is highlighted, in the right, what happens after clicking on it.
Source: https://habr.com/ru/post/73335/
All Articles