Web analytics: analyze it! Part 5. Divide and think
Part 1. Introduction.
Part 2. Data collection.
Part 3. Basic metrics.
Part 4. From statistics to analytics
We continue our journey into the world of web analytics. In the last part, we finally came to grips with analyzing statistics and obtaining information from the collected data. It turned out that we can track the user's behavior, but not the reasons for this behavior. And in order to stimulate desirable actions and prevent undesirable ones, you need to know exactly the reason for these actions.
How, then, experienced analysts "get into the head" to the user, having only averaged data on the site? No magic They carry out procedures that disassemble these Augean stables:
')
- Segment data: divide all users into groups based on certain criteria and consider the behavior of not all users, but each of these groups separately.
- Build assumptions and check them: look for probable explanations for the situation and try to influence the situation on the basis of these assumptions, watching the result.
“Not to segment data is a crime against humanity”
Avinash Koshik
Averaging is what you need to fear the most. You can, of course, summarize the statistics from users who came from advertisements, with statistics from random visitors; add visits from all cities and countries; consider "the average temperature in the hospital, including the morgue," as in a popular joke. However, in this case, you will receive a minimum of useful data, and the conclusions you draw from them are most likely to be incorrect.
Before you begin, please forget everything you know about your users. You have to analyze the impartial statistics, and two things can prevent you: trying to use your own judgments about users and a desire to create an “average portrait” for your entire audience. The opposite is true: the more different portraits, different groups you see, the more you will learn how to please each of these groups.
Segmentation is possible by any parameters that the web analytics system remembers when the page is displayed. For example:
- By region
- To the addresses of sites from which the user came
- For those who saw your site in a search engine - on request, which helped him find it
- For those who came from an ad - on ads and advertising sites
- On the first page the user saw
- According to the technical capabilities of the computer and the user's Internet connection
- By whether the user came to your site earlier
- According to user actions on the site.
Here is a simple example of how segmentation works.
You are the owner of an online store, and you, of course, care about how you can increase its profitability. You go to Google Analytics and see the following picture:
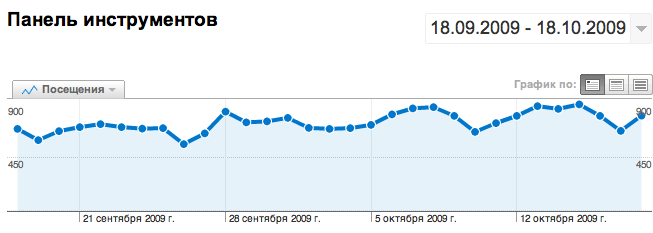
This is the average for all users. They may be of interest only in dynamics - their fluctuations are a signal that the situation has changed and an additional investigation is needed. But the real revelations are waiting for us further, in depth, where the data are segmented by all possible parameters.
Let's go, for example, in the "Content" section. It is convenient to use the “Content by headings” item, because the list is immediately clear (if the site has the correct title tags), which page is it about:
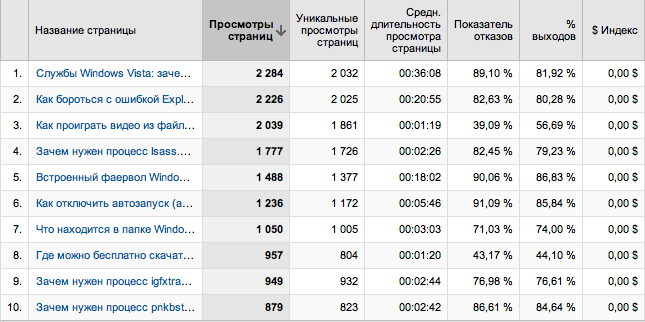
We have just segmented visits to the pages that users opened. Here is more interesting. We can see:
- Which pages are visited most often (page views)
- which ones are most often delayed (average page view duration)
- How many percent of visitors who started browsing the site from this page did not switch to another, but immediately closed the site (Bounce rate)
- How many percent of visitors finished viewing the site on this page (% of outputs).
Note that the accuracy of the parameter count depends on the amount of data collected. For example, having shown the page 10 times and having received 2 refusals, we cannot say with accuracy that the failure rate is 20%: having collected more statistics, we will be able to specify the result, and the real figure can refuse both 10% and 30%. As a first approximation, we can assume that the fluctuations of the value are plus or minus the root of the measured value. So, for example, fluctuations in attendance from 90 to 110 users do not mean a system change in magnitude. Systemic changes are sometimes seen by eye, but you should not rely on it; for accurate measurements, since conventional statistical systems do not allow building trend lines, you can either load statistics into Excel or take large measurement intervals. I will give a more accurate formula for calculating the reliability of the data later.
One problem is related to this, which prevents Google Analytics from being used: when trying to sort pages by indicators, the most unpopular ones go up:
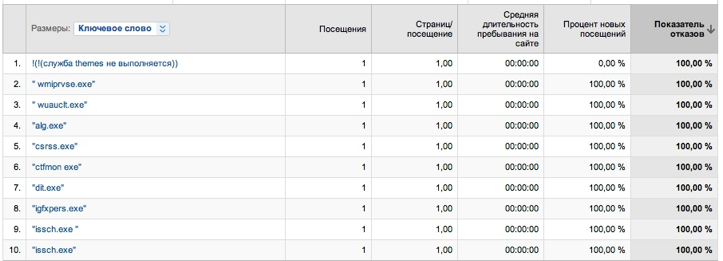
It is clear why this happens, but this data is useless: they have zero accuracy. Depending on the number of pages, keywords or other segments, you can deal with this differently, I honestly do not know the method better than exporting a table with sorting by descending order in Excel, then cut off the “long tail” from it and sort in other fields.
It is clear why this is necessary: those segments for which one of these parameters is unusual are of particular interest: the values for the other segments are noticeably larger or smaller. This usually happens for the following reasons:
- Difference in traffic: users who represent this segment are different from others. For example, for an online store working only for Moscow, visitors from Yekaterinburg will be untargeted, and for them there will be more failures, less achievement of goals and lower depth of viewing.
- Differences in the quality of pages. If the page hides its content from the user and does not help him understand what can be done on the site, does not convince him that he needs to go further, the user is more likely to be lost to the site. In the west, persuasion design is a whole discipline, but more on that later.
- What many people forget about, trying to simplify the model of user interaction with the site is the correspondence of the goals of the user who visits the page and the content of the page. A typical mistake of this kind is the use of the main page of the site as an entrance (landing page) for advertising campaigns. By clicking on an advertisement promising a discount on a specific product, the user can be on the main page of a large store. In this case, it is likely that he does not want or will not be able to find what he had already expected to see. A similar error occurs when the advertiser writes “25% discount!” On the banner while trying to lure more visitors, and “forgets” about his offer on the entrance page of the site.
Reasoning in these three categories, you can create hypotheses and test them, increasing the important indicators for the site.
In the following parts we will talk about drawing up a plan of analysis, building assumptions based on statistics for each of the main parameters and checking them.
Part 2. Data collection.
Part 3. Basic metrics.
Part 4. From statistics to analytics
We continue our journey into the world of web analytics. In the last part, we finally came to grips with analyzing statistics and obtaining information from the collected data. It turned out that we can track the user's behavior, but not the reasons for this behavior. And in order to stimulate desirable actions and prevent undesirable ones, you need to know exactly the reason for these actions.
How, then, experienced analysts "get into the head" to the user, having only averaged data on the site? No magic They carry out procedures that disassemble these Augean stables:
')
- Segment data: divide all users into groups based on certain criteria and consider the behavior of not all users, but each of these groups separately.
- Build assumptions and check them: look for probable explanations for the situation and try to influence the situation on the basis of these assumptions, watching the result.
Data segmentation
“Not to segment data is a crime against humanity”
Avinash Koshik
Averaging is what you need to fear the most. You can, of course, summarize the statistics from users who came from advertisements, with statistics from random visitors; add visits from all cities and countries; consider "the average temperature in the hospital, including the morgue," as in a popular joke. However, in this case, you will receive a minimum of useful data, and the conclusions you draw from them are most likely to be incorrect.
Before you begin, please forget everything you know about your users. You have to analyze the impartial statistics, and two things can prevent you: trying to use your own judgments about users and a desire to create an “average portrait” for your entire audience. The opposite is true: the more different portraits, different groups you see, the more you will learn how to please each of these groups.
Segmentation is possible by any parameters that the web analytics system remembers when the page is displayed. For example:
- By region
- To the addresses of sites from which the user came
- For those who saw your site in a search engine - on request, which helped him find it
- For those who came from an ad - on ads and advertising sites
- On the first page the user saw
- According to the technical capabilities of the computer and the user's Internet connection
- By whether the user came to your site earlier
- According to user actions on the site.
Here is a simple example of how segmentation works.
You are the owner of an online store, and you, of course, care about how you can increase its profitability. You go to Google Analytics and see the following picture:
This is the average for all users. They may be of interest only in dynamics - their fluctuations are a signal that the situation has changed and an additional investigation is needed. But the real revelations are waiting for us further, in depth, where the data are segmented by all possible parameters.
Let's go, for example, in the "Content" section. It is convenient to use the “Content by headings” item, because the list is immediately clear (if the site has the correct title tags), which page is it about:
We have just segmented visits to the pages that users opened. Here is more interesting. We can see:
- Which pages are visited most often (page views)
- which ones are most often delayed (average page view duration)
- How many percent of visitors who started browsing the site from this page did not switch to another, but immediately closed the site (Bounce rate)
- How many percent of visitors finished viewing the site on this page (% of outputs).
Note that the accuracy of the parameter count depends on the amount of data collected. For example, having shown the page 10 times and having received 2 refusals, we cannot say with accuracy that the failure rate is 20%: having collected more statistics, we will be able to specify the result, and the real figure can refuse both 10% and 30%. As a first approximation, we can assume that the fluctuations of the value are plus or minus the root of the measured value. So, for example, fluctuations in attendance from 90 to 110 users do not mean a system change in magnitude. Systemic changes are sometimes seen by eye, but you should not rely on it; for accurate measurements, since conventional statistical systems do not allow building trend lines, you can either load statistics into Excel or take large measurement intervals. I will give a more accurate formula for calculating the reliability of the data later.
One problem is related to this, which prevents Google Analytics from being used: when trying to sort pages by indicators, the most unpopular ones go up:
It is clear why this happens, but this data is useless: they have zero accuracy. Depending on the number of pages, keywords or other segments, you can deal with this differently, I honestly do not know the method better than exporting a table with sorting by descending order in Excel, then cut off the “long tail” from it and sort in other fields.
It is clear why this is necessary: those segments for which one of these parameters is unusual are of particular interest: the values for the other segments are noticeably larger or smaller. This usually happens for the following reasons:
- Difference in traffic: users who represent this segment are different from others. For example, for an online store working only for Moscow, visitors from Yekaterinburg will be untargeted, and for them there will be more failures, less achievement of goals and lower depth of viewing.
- Differences in the quality of pages. If the page hides its content from the user and does not help him understand what can be done on the site, does not convince him that he needs to go further, the user is more likely to be lost to the site. In the west, persuasion design is a whole discipline, but more on that later.
- What many people forget about, trying to simplify the model of user interaction with the site is the correspondence of the goals of the user who visits the page and the content of the page. A typical mistake of this kind is the use of the main page of the site as an entrance (landing page) for advertising campaigns. By clicking on an advertisement promising a discount on a specific product, the user can be on the main page of a large store. In this case, it is likely that he does not want or will not be able to find what he had already expected to see. A similar error occurs when the advertiser writes “25% discount!” On the banner while trying to lure more visitors, and “forgets” about his offer on the entrance page of the site.
Reasoning in these three categories, you can create hypotheses and test them, increasing the important indicators for the site.
In the following parts we will talk about drawing up a plan of analysis, building assumptions based on statistics for each of the main parameters and checking them.
Source: https://habr.com/ru/post/72800/
All Articles