Full visualization of web analytics
Coming to these notes, I revised the “ 1984 ” textbook, which Apple at one time vividly opposed to the world of dullness and tediousness, which at that time meant IBM personal computers.
These are the associations that the Webvisor startup (Webvisor) spawns . He offers not just a fundamentally new approach to Internet analytics. Among all such systems, it stands out for its brightness and clarity, opposing themselves to a certain tediousness of reports of Internet counters, even if they are not similar to Big Brother. The WebVisor approach is based on a detailed visual analysis of the behavior of each visitor.
What does an internet analyst look like in the last dozen years? The site owner occasionally enters the system interface and tries to understand what people did on the site and how to improve the site and increase its traffic. This is only rarely possible, since the graphs and numerical reports provided by modern analytics do little for an unprepared person. And even a professional, in order to make any practical recommendations based on statistical data, a lot of work needs to be done.
An analysis of an advertising campaign is almost always reduced to setting up a slice (filter) on an advertising platform and / or advertising medium and calculating the cost of the target action (CPA).
And in the analysis of site usability, textbook algorithms using Internet analytics are not known to me at all, except for the Spivak diagram.
')
Why is that? Because statistics does not generate direct recommendations - “here you need to add a link, change the menu structure here, and here increase the size of images in the gallery”. It gives only indirect material for thought.
However, direct prompts are necessary, because an independent, speculative analysis of a site is like a self-massage: pleasant, but a bit confusing ... After all, our brain (remember at least the notorious “zamylennye look”) usually plays with us a “bad joke”, so the project manager, webmaster or the designer cannot independently carry out a full-fledged analysis of the site, which had its origins.
Most site owners have no desire to meditate on the numbers and graphs obtained from traditional Internet analytics systems. The principle of “it’s better to see once than to hear a hundred times” works for them. Those. much more understanding will give an opportunity to see for themselves what specific visitors are doing on the site. The visitor, who today asleep three times missed the mouse past the link. A visitor who did not find the “Contacts” section and left the site. The visitor, who did not read the text, at the end of which was important information, and closed the page. But it’s impossible to stand behind each of them and watch what he does?
For such an analysis of visitors' actions, it is now sufficient to use the capabilities of the WebVisor service.
It allows not to simulate the behavior of visitors based on indirect data, but to see.
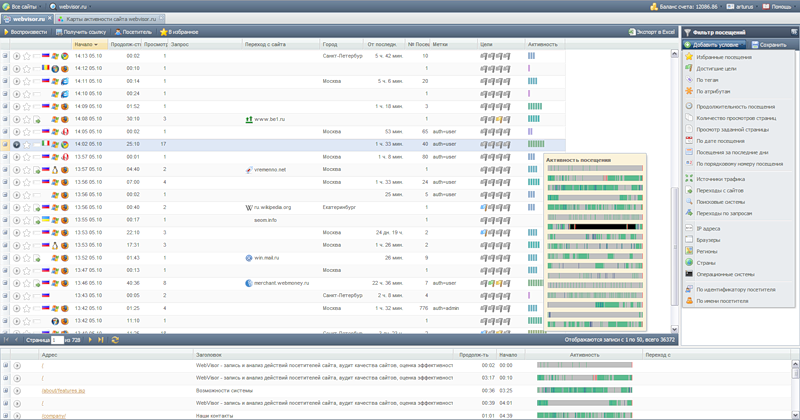
Scroll through the player video, showing every movement, every click, every window switch selected visitor.
Such a mapping of real-time actions of visitors to the site is not only an analytical, but also a spectacular and entertaining service. However, it is the entertainment side that can attract a large number of new users.

Select the user of interest to view his actions in WebVisor.

View selected user's actions in WebVisor.
If we continue to talk about reducing risks in the decision-making process - the goals of ideal analytics, then on September 22 at one of the industry conferences the “Activity Maps” were shown, intended for the new version of WebVisor.
In English terminology, they got the name “heatmaps”, which is well suited to its ambiguity. These are the maps of the most “hot” zones on the site, from the basic meaning “heat” means “heat”, and at the same time a map of mouse runs, from the sports term “heat” (git), which is in athletics, cycling, motorcycle and equestrian sports - single race or race for a certain distance.
In Russian such a capacious term has not yet been invented. The activity of all visitors (or a certain segment of visitors) on the selected page for a specified time interval is shown in the system in terms of the Clicks Map, the Scrolls Map and the Attention Map. In contrast to the generally accepted approximate methods of constructing maps based on binding events to screen coordinates, this implementation of maps in WebVisor links events not to screen coordinates, but to individual tags on the page. As a result, differences in the display of the page by different browsers, differences in the screen resolution of visitors and small changes in the page over time, do not reduce the accuracy of the map.

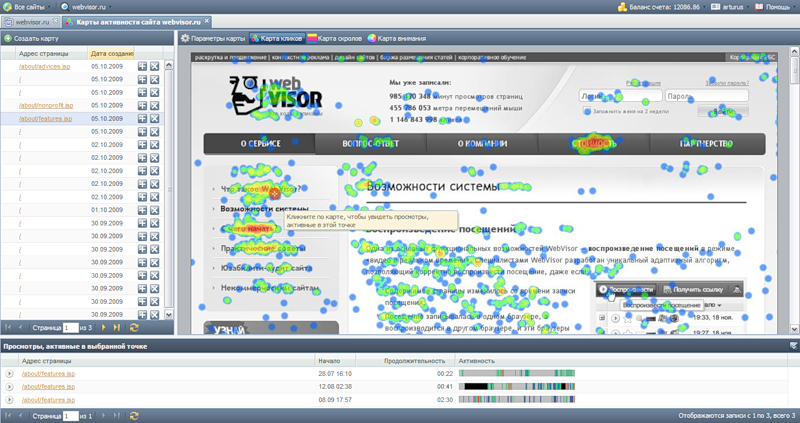
The map of clicks with a small sample (it looks like this with a larger sample).
Pay attention to the lower part of the illustration “Views at the selected point”, where the report on the selected point of the map is given.

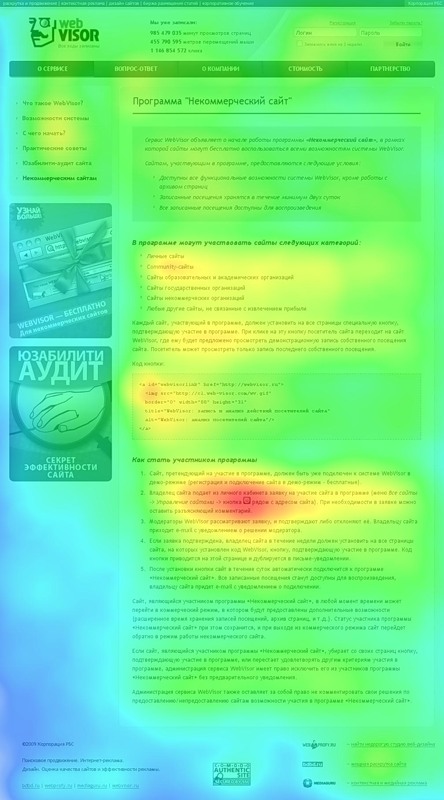
Attention card.
Agree, it would be nice to see on such maps the color separation of the visitors' segments, for example, to display the activity of visitors who came for paid advertising in shades of red, and the activity of visitors who came through links in shades of blue. With this mapping, you can visually compare the difference between the behavior of visitors from these two segments.

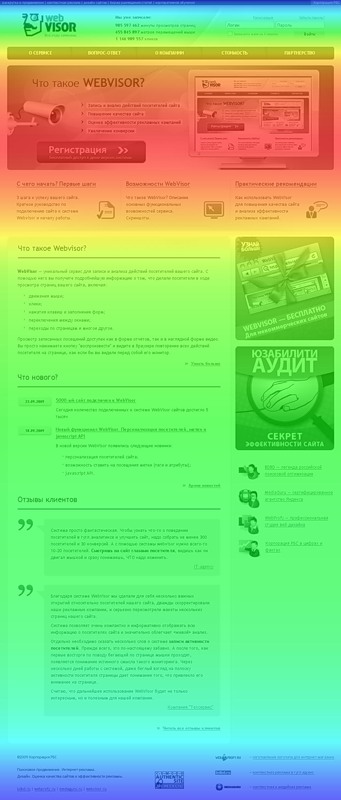
Scroll map (activity map with scrolling page). And an example of such a card is for a longer page.
In the nineties, systems like Webvisor could not appear. It was just the increase in the capacity of hard drives, their cheaper prices, the expansion of the bandwidth of Internet channels and other technical prerequisites that made it possible to create a new generation of Internet analytics systems - the visual one.
And although we have seen Internet marketing in RuNet going from a hyperlink to behavioral targeting, the real motives of human behavior are deeply hidden in the individual and social subconscious. So there were no examples of successful modeling of the behavior of Russian Internet users in my memory, and search advertising is still considered to be the most impeccable targeting.
Therefore, many useful and functional, already demonstrated in WebVisor.
But do not be surprised when there are no open source scripts for this purpose on the Internet. This tiny market is still formed by one Israeli, several American and one domestic system - WebVisor. By the ability to work with "rubber designs" and some other parameters, WebVisor surpasses the world analogues. As long as the price of entering the market is about a year to develop the system, he has a chance to collect “dividends” from his enterprise. What do you think?
These are the associations that the Webvisor startup (Webvisor) spawns . He offers not just a fundamentally new approach to Internet analytics. Among all such systems, it stands out for its brightness and clarity, opposing themselves to a certain tediousness of reports of Internet counters, even if they are not similar to Big Brother. The WebVisor approach is based on a detailed visual analysis of the behavior of each visitor.
What does an internet analyst look like in the last dozen years? The site owner occasionally enters the system interface and tries to understand what people did on the site and how to improve the site and increase its traffic. This is only rarely possible, since the graphs and numerical reports provided by modern analytics do little for an unprepared person. And even a professional, in order to make any practical recommendations based on statistical data, a lot of work needs to be done.
An analysis of an advertising campaign is almost always reduced to setting up a slice (filter) on an advertising platform and / or advertising medium and calculating the cost of the target action (CPA).
And in the analysis of site usability, textbook algorithms using Internet analytics are not known to me at all, except for the Spivak diagram.
')
Why is that? Because statistics does not generate direct recommendations - “here you need to add a link, change the menu structure here, and here increase the size of images in the gallery”. It gives only indirect material for thought.
However, direct prompts are necessary, because an independent, speculative analysis of a site is like a self-massage: pleasant, but a bit confusing ... After all, our brain (remember at least the notorious “zamylennye look”) usually plays with us a “bad joke”, so the project manager, webmaster or the designer cannot independently carry out a full-fledged analysis of the site, which had its origins.
Most site owners have no desire to meditate on the numbers and graphs obtained from traditional Internet analytics systems. The principle of “it’s better to see once than to hear a hundred times” works for them. Those. much more understanding will give an opportunity to see for themselves what specific visitors are doing on the site. The visitor, who today asleep three times missed the mouse past the link. A visitor who did not find the “Contacts” section and left the site. The visitor, who did not read the text, at the end of which was important information, and closed the page. But it’s impossible to stand behind each of them and watch what he does?
For such an analysis of visitors' actions, it is now sufficient to use the capabilities of the WebVisor service.
It allows not to simulate the behavior of visitors based on indirect data, but to see.
Scroll through the player video, showing every movement, every click, every window switch selected visitor.
Such a mapping of real-time actions of visitors to the site is not only an analytical, but also a spectacular and entertaining service. However, it is the entertainment side that can attract a large number of new users.

Select the user of interest to view his actions in WebVisor.

View selected user's actions in WebVisor.
If we continue to talk about reducing risks in the decision-making process - the goals of ideal analytics, then on September 22 at one of the industry conferences the “Activity Maps” were shown, intended for the new version of WebVisor.
In English terminology, they got the name “heatmaps”, which is well suited to its ambiguity. These are the maps of the most “hot” zones on the site, from the basic meaning “heat” means “heat”, and at the same time a map of mouse runs, from the sports term “heat” (git), which is in athletics, cycling, motorcycle and equestrian sports - single race or race for a certain distance.
In Russian such a capacious term has not yet been invented. The activity of all visitors (or a certain segment of visitors) on the selected page for a specified time interval is shown in the system in terms of the Clicks Map, the Scrolls Map and the Attention Map. In contrast to the generally accepted approximate methods of constructing maps based on binding events to screen coordinates, this implementation of maps in WebVisor links events not to screen coordinates, but to individual tags on the page. As a result, differences in the display of the page by different browsers, differences in the screen resolution of visitors and small changes in the page over time, do not reduce the accuracy of the map.

The map of clicks with a small sample (it looks like this with a larger sample).
Pay attention to the lower part of the illustration “Views at the selected point”, where the report on the selected point of the map is given.

Attention card.
Agree, it would be nice to see on such maps the color separation of the visitors' segments, for example, to display the activity of visitors who came for paid advertising in shades of red, and the activity of visitors who came through links in shades of blue. With this mapping, you can visually compare the difference between the behavior of visitors from these two segments.

Scroll map (activity map with scrolling page). And an example of such a card is for a longer page.
In the nineties, systems like Webvisor could not appear. It was just the increase in the capacity of hard drives, their cheaper prices, the expansion of the bandwidth of Internet channels and other technical prerequisites that made it possible to create a new generation of Internet analytics systems - the visual one.
And although we have seen Internet marketing in RuNet going from a hyperlink to behavioral targeting, the real motives of human behavior are deeply hidden in the individual and social subconscious. So there were no examples of successful modeling of the behavior of Russian Internet users in my memory, and search advertising is still considered to be the most impeccable targeting.
Therefore, many useful and functional, already demonstrated in WebVisor.
But do not be surprised when there are no open source scripts for this purpose on the Internet. This tiny market is still formed by one Israeli, several American and one domestic system - WebVisor. By the ability to work with "rubber designs" and some other parameters, WebVisor surpasses the world analogues. As long as the price of entering the market is about a year to develop the system, he has a chance to collect “dividends” from his enterprise. What do you think?
This article is like a doublet with my current publication in "IT-biographies" .
Source: https://habr.com/ru/post/71560/
All Articles