Load average
Observing the findings of commands such as top , htop , uptime , w and, possibly, others, the user probably paid attention to the load average line:
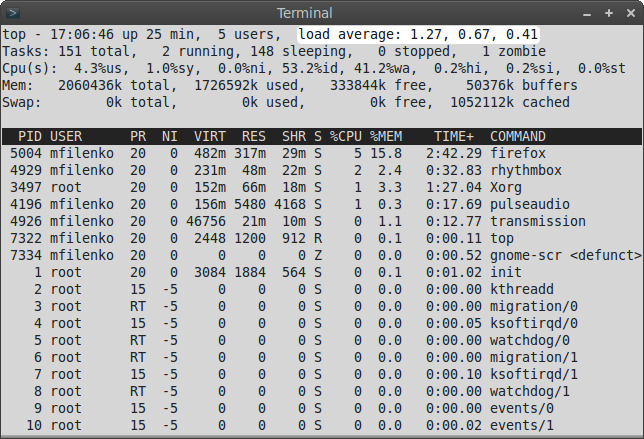
Expanding the discussion in the " General Review of Standard Observing Systems for the System ", we will try to make out the meaning of these numbers. So, simply put, the numbers reflect the number of blocking processes in the queue for execution at a certain time interval, namely 1 minute, 5 minutes and 15 minutes, respectively. The concept of blocking processes is usually well covered in recent times when talking about nginx . :) In this case, the blocking process is a process that expects resources to continue. As a rule, there is an expectation of such resources as the central processor, the disk I / O subsystem or the network I / O subsystem.
')
High values of load average indicate that the system can not cope with the load. If we are talking about a target server operating under high load, then it is usually useful to fine-tune the operating system (network subsystem, limit on the number of simultaneously open files, etc.). High load can also be caused by hardware problems, such as drive failure.
For diagnostic, refer to other useful data provided by the top output. The string Cpu (s) contains information about the distribution of processor time. The first two values directly reflect the work of the CPU in processing processes:
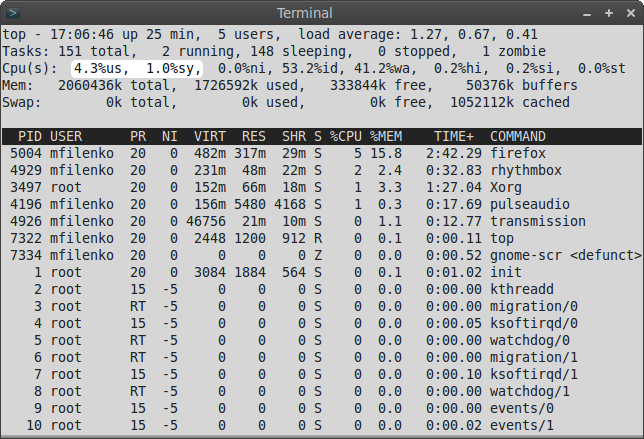
Long high (99-100%) indicators point to the CPU as a bottleneck.
The wa parameter says simple I / O related:
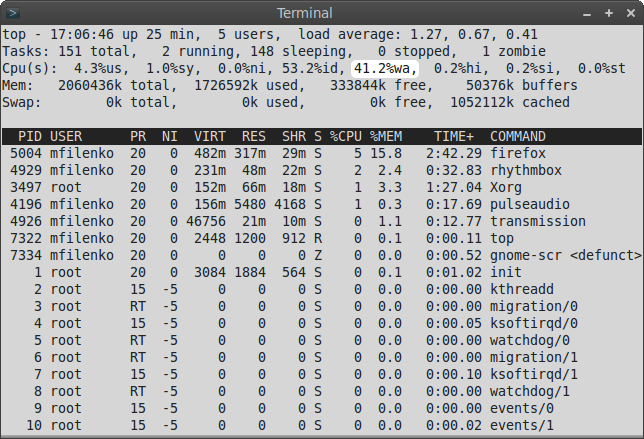
Above 80% is considered not quite normal and clearly indicates to us that the processor spends a lot of time waiting for input / output (this usually means that the HDD or NIC fails).
If the hardware is OK and the CPU is fast, most likely the problem is in the software. The problem application can be caught using ps axfu . The resulting output will provide a list of processes, as well as the necessary information: CPU consumption, memory consumption, status, and, directly, information identifying the process (PID and command). Speaking of process states. The typical process states are the following three (the full list is available on the man ps man page - thanks , onix74 ):
The last is what we are looking for. Further debugging can be done with iostat , systat (FreeBSD), strace , iperf , but this is a topic for another article.
High uptime, low load average, and of course good luck! :)
Expanding the discussion in the " General Review of Standard Observing Systems for the System ", we will try to make out the meaning of these numbers. So, simply put, the numbers reflect the number of blocking processes in the queue for execution at a certain time interval, namely 1 minute, 5 minutes and 15 minutes, respectively. The concept of blocking processes is usually well covered in recent times when talking about nginx . :) In this case, the blocking process is a process that expects resources to continue. As a rule, there is an expectation of such resources as the central processor, the disk I / O subsystem or the network I / O subsystem.
')
High values of load average indicate that the system can not cope with the load. If we are talking about a target server operating under high load, then it is usually useful to fine-tune the operating system (network subsystem, limit on the number of simultaneously open files, etc.). High load can also be caused by hardware problems, such as drive failure.
For diagnostic, refer to other useful data provided by the top output. The string Cpu (s) contains information about the distribution of processor time. The first two values directly reflect the work of the CPU in processing processes:
Long high (99-100%) indicators point to the CPU as a bottleneck.
The wa parameter says simple I / O related:
Above 80% is considered not quite normal and clearly indicates to us that the processor spends a lot of time waiting for input / output (this usually means that the HDD or NIC fails).
If the hardware is OK and the CPU is fast, most likely the problem is in the software. The problem application can be caught using ps axfu . The resulting output will provide a list of processes, as well as the necessary information: CPU consumption, memory consumption, status, and, directly, information identifying the process (PID and command). Speaking of process states. The typical process states are the following three (the full list is available on the man ps man page - thanks , onix74 ):
- S - the so-called sleep state;
- R is the execution status;
- D - waiting state.
The last is what we are looking for. Further debugging can be done with iostat , systat (FreeBSD), strace , iperf , but this is a topic for another article.
High uptime, low load average, and of course good luck! :)
Source: https://habr.com/ru/post/71020/
All Articles