LiveJournal Record Statistics

Under the cat a small statistical study that may be just interesting, and may be useful to those who develop or support services based on the LiveJournal.
The second version of the study .
Research method
For research diaries of users were taken from the statistics page. Five diaries from every 10 pages. A total of 200 users were retrieved. Each one had all the records uploaded since 1999, with the exception of the subzamochny and 18+. 190 439 records left. Records, in turn, were extracted headlines, tags, text without HTML markup and the number of comments. The sample is not very large, less than a percentage, but quite representative as a basis on which to design services for LJ. In some graphs, users of the first five were excluded, since created a very big noise. :) So, let's go.
Records
Header availability

Green is, gray is not.
Header length in characters

')
Character length
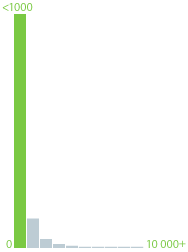
One column - 1000 characters.
Articles per month

By the day of the week
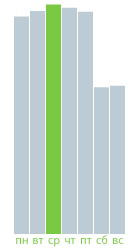
By the hour

Tags
Is there or not?
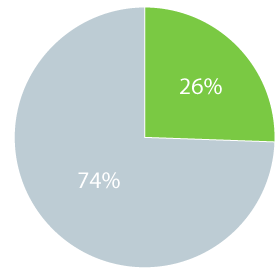
Green is, gray is not.
Number of tags

Tag length
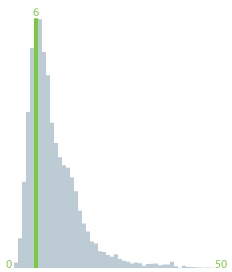
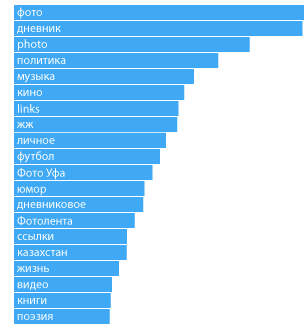
Popular tags
Comments
Number of comments to the post

Number of comments to the entry in the form of a pie

Number of comments from the amount of text
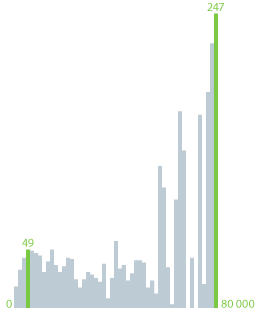
Column - 1000 characters.
80,000 - a glitch: the comments themselves were in the text of the record.
P.S.
I hope that this analysis was interesting to someone. Or maybe he will even make some project a little more convenient. I’ll be happy to extract other metrics from the database if they are needed by someone.
P.P.S.
By next week I will make a more representative sample of 10,000 users with entries for 2006 only.
Source: https://habr.com/ru/post/69922/
All Articles