Web analytics: analyze it! Part 4. From statistics to analytics
I apologize for the long pause between the releases of the newsletter: I needed time to prepare for the big training and raking out new materials. Well, a lot of time has passed, much has changed - even the word “Internet” now needs to be written with a capital letter! More of this will not happen again, so we continue our journey. Let me remind you the addresses of past issues:
Part 1. Introduction.
Part 2. Data collection.
Part 3. Basic metrics.
Before proceeding to the description of metrics and analysis technologies, I want to remind once again about why we spend our time on this. It makes sense to study the behavior of an audience only when you would like it to behave in a certain way. So that:
Why are we talking about setting goals again? Firstly, this is the most important thing, and secondly, for those goals, the achievement of which we can track through the statistics system, data acquisition can be automated. In e-commerce analytics systems such as Google Analytics and Yandex.Metrica, there is a way to record the achievement of goals and even calculate the profits that a company receives from achieving them.
')
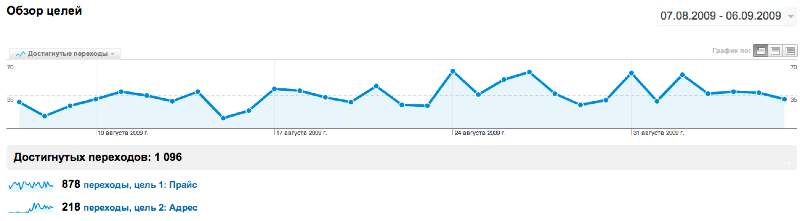

Usually, the goal is set by the address of the page that the user visits - for example, for an online store, the goal may be “placing an order”, and the corresponding page - information that the order is accepted. You can set several goals and link their achievement to advertising campaigns in contextual advertising, which will make it possible to directly estimate the cost of the attracted buyer (the cost of an advertisement click divided by the percentage of people who clicked, who then bought the product).
If you sell products online, Google Analytics is able to account for the profit from each transaction. To do this, you need to include an “Electronic Commerce” section in Analytics and force your website to transfer profit data to the script code . Such an accounting system will provide you with very interesting data - for contextual advertising, for example, it will be the profitability of each ad.
If your site is a simple business card, and the goal is sales of a product or service, then, of course, no statistics will allow you to determine the achievement of this goal. In such cases it is necessary:
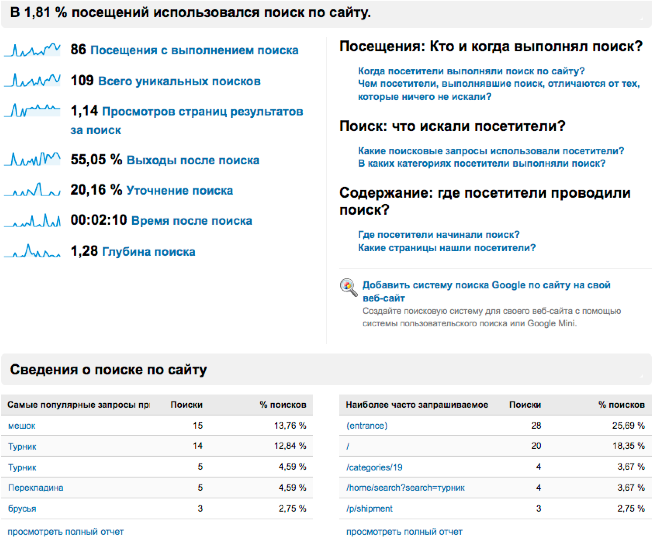
Another important custom metric is to take into account queries to the internal search engine. For example, Google Analytics allows you to track such queries and compile statistics on them.

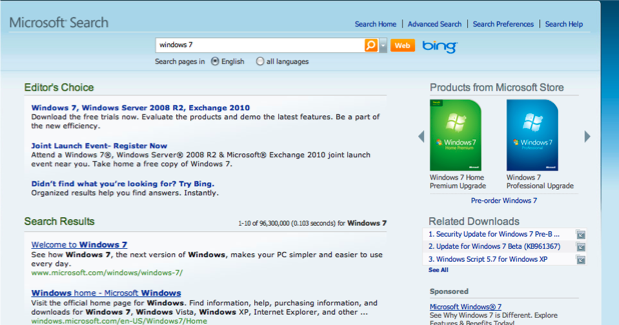
Requests to search on the site are a good source of information about what users lack, where in the site navigation is difficult and how to adjust the search results manually so that the results required by the user are higher. The “correct” search system almost always contains additional “manually added” links - for example, the search page on Microsoft.com:
The analysis of the internal search helps in choosing such links.
Having a complete set of statistical data and a customized accounting of goals, you can go from the “statistical” part directly to the analytical one: try to use the data obtained in order to make decisions about the correction of the advertising campaign, the appearance of the site pages or the range of products. Analytical work as a whole consists of three stages:
However, here we are waiting for difficulties. One of the main problems in the analysis of Internet statistics data, as in other areas of marketing, is the incorrect definition of cause-effect relationships. Suppose that these analysts say that a particular product is viewed more often, and bought - less. A completely inexperienced marketer will assume that “there is such an audience on the Internet,” a slightly more advanced analyst will immediately state several possible reasons:
Most likely, the different results are the result of several reasons at once, but which ones exactly are to be learned from a more thorough analysis. Data segmentation and testing can help determine true cause-effect relationships. I will tell you about them in detail in the following sections.
Part 1. Introduction.
Part 2. Data collection.
Part 3. Basic metrics.
Before proceeding to the description of metrics and analysis technologies, I want to remind once again about why we spend our time on this. It makes sense to study the behavior of an audience only when you would like it to behave in a certain way. So that:
- Before working with data it is necessary to determine the goals that you pursue on the site.
- Goals must be measurable.
- For a commercial site, goals should be as close as possible to making a profit.
- The true purpose of online marketing activities is offline.
Why are we talking about setting goals again? Firstly, this is the most important thing, and secondly, for those goals, the achievement of which we can track through the statistics system, data acquisition can be automated. In e-commerce analytics systems such as Google Analytics and Yandex.Metrica, there is a way to record the achievement of goals and even calculate the profits that a company receives from achieving them.
')

Usually, the goal is set by the address of the page that the user visits - for example, for an online store, the goal may be “placing an order”, and the corresponding page - information that the order is accepted. You can set several goals and link their achievement to advertising campaigns in contextual advertising, which will make it possible to directly estimate the cost of the attracted buyer (the cost of an advertisement click divided by the percentage of people who clicked, who then bought the product).
If you sell products online, Google Analytics is able to account for the profit from each transaction. To do this, you need to include an “Electronic Commerce” section in Analytics and force your website to transfer profit data to the script code . Such an accounting system will provide you with very interesting data - for contextual advertising, for example, it will be the profitability of each ad.
If your site is a simple business card, and the goal is sales of a product or service, then, of course, no statistics will allow you to determine the achievement of this goal. In such cases it is necessary:
- Track how many customers came to you from the site in one of inaccurate ways .
- Track the achievement of “closest to selling” goals — for example, viewing a price list.
Another important custom metric is to take into account queries to the internal search engine. For example, Google Analytics allows you to track such queries and compile statistics on them.

Requests to search on the site are a good source of information about what users lack, where in the site navigation is difficult and how to adjust the search results manually so that the results required by the user are higher. The “correct” search system almost always contains additional “manually added” links - for example, the search page on Microsoft.com:

The analysis of the internal search helps in choosing such links.
Having a complete set of statistical data and a customized accounting of goals, you can go from the “statistical” part directly to the analytical one: try to use the data obtained in order to make decisions about the correction of the advertising campaign, the appearance of the site pages or the range of products. Analytical work as a whole consists of three stages:
- To get data
- Draw conclusions on why the data looks like this.
- Propose changes that would improve the situation.
However, here we are waiting for difficulties. One of the main problems in the analysis of Internet statistics data, as in other areas of marketing, is the incorrect definition of cause-effect relationships. Suppose that these analysts say that a particular product is viewed more often, and bought - less. A completely inexperienced marketer will assume that “there is such an audience on the Internet,” a slightly more advanced analyst will immediately state several possible reasons:
- The text of one ad is more attractive and creates excessive expectations among the audience.
- The resources on which ads are published have a specific audience.
- Product description pages are unequal in quality.
- The products themselves have a different level of conversion.
Most likely, the different results are the result of several reasons at once, but which ones exactly are to be learned from a more thorough analysis. Data segmentation and testing can help determine true cause-effect relationships. I will tell you about them in detail in the following sections.
Source: https://habr.com/ru/post/68966/
All Articles