What will we see in Visio 2010?
Charting with Containers
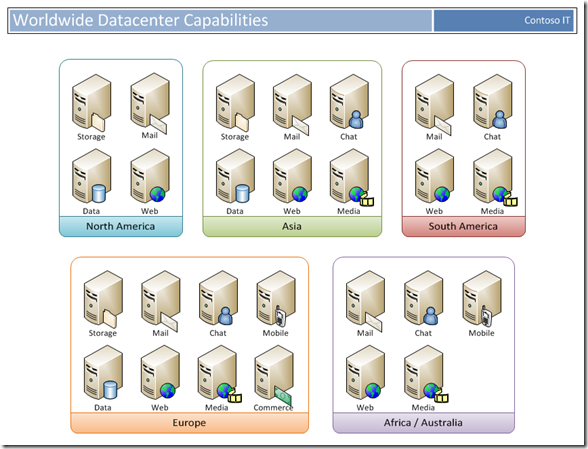
As soon as the product team started planning Visio 2010, we collected a large number of user sketches. Among thousands of diagrams with different types, we still found common similarities. As the diagram became more complex, users added special shapes to clarify. Often, users draw frames around cluster objects in order to isolate them into a separate logical group. This brought us to the idea that we can help in this kind of organization of data, as a result of which the function of Containers was born.
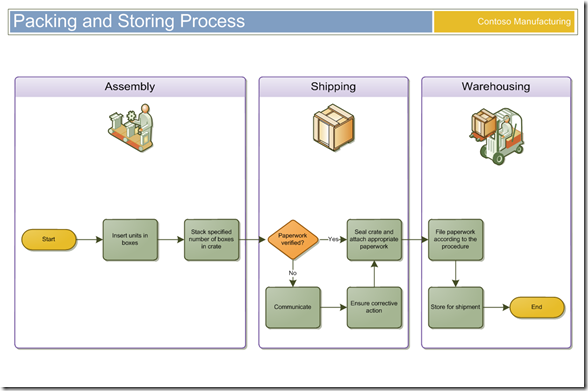
You've probably already used something similar to containers in Visio. Previously, for this you drew a rectangle around the shapes, moved it to the back of the shape, added a text label and placed next to the frame of the rectangle, and then it was still grouped. Yes, it worked, but delivered a lot of inconvenience, a little bit, it was necessary to ungroup the object and make changes, and then group it again.
')
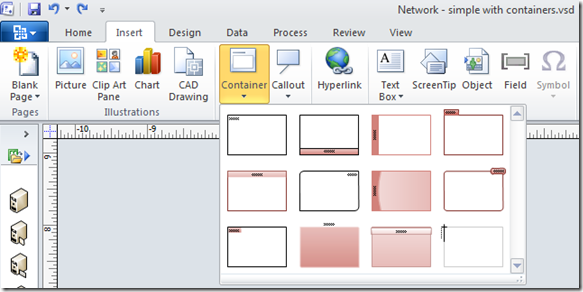
The Containers feature makes it easy to add visual borders around the shapes by adding a text label. Visio takes care of the relationship between the container and its contents. To add a container to the chart, select the shapes that will be placed in it. Next, select the Container command from the Insert tab. Gallery allows you to choose from several styles.
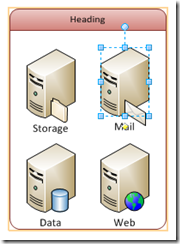
The figures inside the container are not grouped, therefore, you have direct access to work with them. Adding or deleting shapes is very simple - just drag the shape into or out of the container. During the movement of the shape, the container is highlighted in orange. The container is able to independently decrease or increase in order to accommodate the figures in it.
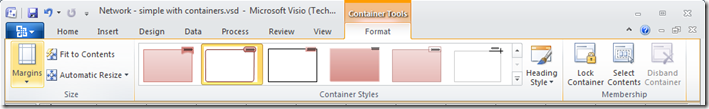
Containers can be formatted as a regular shape. The position of the heading can be changed using the paragraph layout buttons on the Home tab. Also present specials. A tab that allows you to customize the container for yourself. You can adjust the internal indents of the container or you can adjust the container to the size of the content. It is also possible to block the container to prohibit any action on it.
With the help of containers you can kill two birds with one stone - get a visual and logical grouping of the figures in the diagram. Your charts will look readable and professional.
Source: https://habr.com/ru/post/68053/
All Articles