Web analytics: analyze it! Part 3. Basic metrics
Previous parts:
Part 1. Introduction
Part 2. Data Collection
It's time to talk about metrics - the values that any statistics system considers. Let's start with direct metrics - those that can be calculated easily and without the use of formulas.
Pageviews
The most obvious, simple and simple counter counts the number of downloads of the page body to the user's browser. Despite its simplicity, there are already a few limitations:
JS counters will calculate the download only when the user's browser allows you to perform JavaScript and the page has managed to load in its entirety. Log analyzers will also consider file downloads, but to separate downloads of pages from downloads of additional files may require additional settings.
')
JS counters will not consider page loading as a search engine indexing robot. Log analyzers will also count such visits, but again they may not distinguish them from regular user visits.
Visitors (unique visitors, users, reach, visitors, reach)
The statistics system analyzes all pageviews recorded for it and tries to determine which of them were produced from a single browser. Summing up the number of different browsers over a period of time, it counts the “number of unique visitors”, implying that one user uses one browser.
JS counters define the “uniqueness” of a visitor, leaving a cookie in his browser with a unique number during the first visit. All visits from this user will now be combined with this ID. The same goes for advanced log analyzers.
Own statistics systems can measure not only the number of unique visitors, but also the visits of registered users (who entered their name and password for this site). Do not confuse these two metrics.
It is important to understand that the coverage cannot be summed up: if today you have 2,000 unique visitors, and tomorrow there will be 3,000, then, not knowing how many of them came again, you cannot count the total coverage - it can be from 3,000 to 5,000 users. But the statistics system, remembering the unique code of each user and viewing the page, can inform you of this information for each time interval.
Google Analytics sets up a cookie called __utma for 2 years to track unique visitors.
Visits (sessions, visits)
Each unique user can make one or several visits to the site. A visit is a few site views within a limited time interval. For example, Google Analytics considers one visit page views, between which less than half an hour has passed, and the browser has not been closed. If the user opened the site page and went to dinner for an hour, and then clicked the link to “contacts”, it will be two visits already.
Google Analytics sets up two cookies for tracking visits, giving the browser different settings for deleting them:
__utmb is deleted 30 minutes after installation. Google Analytics updates this cookie every time you open a page, and if it doesn’t find it, it counts the opening of a new visit.
__utmc is deleted when the browser is closed. If this cookie is not present, a new visit begins.
Liveinternet.ru considers visits to the page at intervals of not more than 15 minutes.
Geography
By comparing the user's IP address with the geo-referenced database available, the statistics system assigns each user a region. Based on this, it is easy to calculate the distribution of site visitors by region. Google Analytics even depicts the relative activity of users from different regions on the map:


Browsers
Based on the identification string sent by the browser in the request, the server determines which browser the client is using and if it is a search robot. Depending on the specifics of the site and its audience, these statistics may not coincide with the average runet (because of this, there are "shocking" graphics that display a huge advantage of alternative browsers - they did not consider the entire Internet, but only certain sites).

Sources of transition
The browser tells the server from which page the user clicked on the link to find himself on the current page. This information is used for segmentation, analysis of traffic sources and many other purposes.
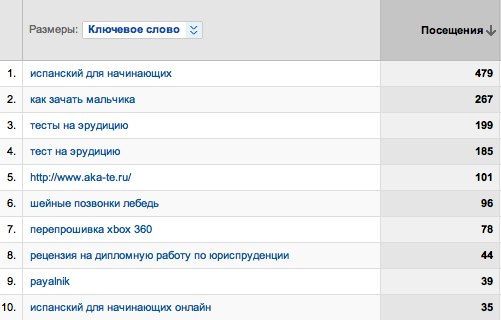
Additional information can be extracted from the page address: for example, a keyword that a user entered in Yandex, after which he saw a link to your website. Sometimes it looks ridiculous, but the use of this data is very serious.
Pages to visit
The simplest derivative metric is the average number of pages opened by the user during one visit. For many types of site, this parameter determines the interest of the audience ... but let's not get too far ahead!
Waivers
Another criterion for the quality of the site and the audience is “bounce rate”. This is the number of visitors (usually a percentage of the total) who visited only one page on the site.
Time on site
Frequently measured metric - the time that the user spent on the site. However, since all common statistical systems record only the page opening time, it is impossible to measure the time spent by the user on the last of the open pages. Therefore, it does not work and measure the average viewing time for those who have not moved further than the first page.
Special actions
In order to process the actions of users who are not connected with the loading of new pages (loading using AJAX, watching videos on the page, staying on it for a while, etc.), additional efforts are required.
Google Analytics allows page elements to call the special _trackEvent () function in order to record a record of such a special event in the statistics system.
In the following sections we will talk about more complex metrics, segmentation and decision making using statistics data, but for now, if you are not familiar with LiveInternet data on the sites of the RuNet, you can explore this data at www.liveinternet.ru/stat/ru . Here, the metrics described above are summed up for all sites that use the Li.ru counter, and quite interesting trends can be observed right away. At the bottom of each page there is a brief description of counted metrics that helps to navigate them.
Part 1. Introduction
Part 2. Data Collection
It's time to talk about metrics - the values that any statistics system considers. Let's start with direct metrics - those that can be calculated easily and without the use of formulas.
Pageviews
The most obvious, simple and simple counter counts the number of downloads of the page body to the user's browser. Despite its simplicity, there are already a few limitations:
JS counters will calculate the download only when the user's browser allows you to perform JavaScript and the page has managed to load in its entirety. Log analyzers will also consider file downloads, but to separate downloads of pages from downloads of additional files may require additional settings.
')
JS counters will not consider page loading as a search engine indexing robot. Log analyzers will also count such visits, but again they may not distinguish them from regular user visits.
Visitors (unique visitors, users, reach, visitors, reach)
The statistics system analyzes all pageviews recorded for it and tries to determine which of them were produced from a single browser. Summing up the number of different browsers over a period of time, it counts the “number of unique visitors”, implying that one user uses one browser.
JS counters define the “uniqueness” of a visitor, leaving a cookie in his browser with a unique number during the first visit. All visits from this user will now be combined with this ID. The same goes for advanced log analyzers.
Own statistics systems can measure not only the number of unique visitors, but also the visits of registered users (who entered their name and password for this site). Do not confuse these two metrics.
It is important to understand that the coverage cannot be summed up: if today you have 2,000 unique visitors, and tomorrow there will be 3,000, then, not knowing how many of them came again, you cannot count the total coverage - it can be from 3,000 to 5,000 users. But the statistics system, remembering the unique code of each user and viewing the page, can inform you of this information for each time interval.
Google Analytics sets up a cookie called __utma for 2 years to track unique visitors.
Visits (sessions, visits)
Each unique user can make one or several visits to the site. A visit is a few site views within a limited time interval. For example, Google Analytics considers one visit page views, between which less than half an hour has passed, and the browser has not been closed. If the user opened the site page and went to dinner for an hour, and then clicked the link to “contacts”, it will be two visits already.
Google Analytics sets up two cookies for tracking visits, giving the browser different settings for deleting them:
__utmb is deleted 30 minutes after installation. Google Analytics updates this cookie every time you open a page, and if it doesn’t find it, it counts the opening of a new visit.
__utmc is deleted when the browser is closed. If this cookie is not present, a new visit begins.
Liveinternet.ru considers visits to the page at intervals of not more than 15 minutes.
Geography
By comparing the user's IP address with the geo-referenced database available, the statistics system assigns each user a region. Based on this, it is easy to calculate the distribution of site visitors by region. Google Analytics even depicts the relative activity of users from different regions on the map:
Browsers
Based on the identification string sent by the browser in the request, the server determines which browser the client is using and if it is a search robot. Depending on the specifics of the site and its audience, these statistics may not coincide with the average runet (because of this, there are "shocking" graphics that display a huge advantage of alternative browsers - they did not consider the entire Internet, but only certain sites).
Sources of transition
The browser tells the server from which page the user clicked on the link to find himself on the current page. This information is used for segmentation, analysis of traffic sources and many other purposes.
Additional information can be extracted from the page address: for example, a keyword that a user entered in Yandex, after which he saw a link to your website. Sometimes it looks ridiculous, but the use of this data is very serious.
Pages to visit
The simplest derivative metric is the average number of pages opened by the user during one visit. For many types of site, this parameter determines the interest of the audience ... but let's not get too far ahead!
Waivers
Another criterion for the quality of the site and the audience is “bounce rate”. This is the number of visitors (usually a percentage of the total) who visited only one page on the site.
Time on site
Frequently measured metric - the time that the user spent on the site. However, since all common statistical systems record only the page opening time, it is impossible to measure the time spent by the user on the last of the open pages. Therefore, it does not work and measure the average viewing time for those who have not moved further than the first page.
Now JS-systems gain popularity, fixing not only page loads, but also every user action on the site, even mouse movements (for example, the domestic Webvisor system). They easily cope with this task.It is also impossible to estimate how much of the time the user actually watched the page, and how much it was open in the background, in the next window, and so on.
Special actions
In order to process the actions of users who are not connected with the loading of new pages (loading using AJAX, watching videos on the page, staying on it for a while, etc.), additional efforts are required.
Google Analytics allows page elements to call the special _trackEvent () function in order to record a record of such a special event in the statistics system.
In the following sections we will talk about more complex metrics, segmentation and decision making using statistics data, but for now, if you are not familiar with LiveInternet data on the sites of the RuNet, you can explore this data at www.liveinternet.ru/stat/ru . Here, the metrics described above are summed up for all sites that use the Li.ru counter, and quite interesting trends can be observed right away. At the bottom of each page there is a brief description of counted metrics that helps to navigate them.
Source: https://habr.com/ru/post/66923/
All Articles