Experience building a GOOG-411 [first-person]
M. Bacchiani, F. Beaufays, J. Schalkwyk, M. Schuster, B. Strope
ANNOTATION
We describe our first experience in developing and optimizing GOOG-411, a fully automated business search using voice. We show how the adoption of an iterative approach to system design allows us to optimize the various components of the system, thus gradually improving the performance with which users interact. We show the contribution of various data sources to recognition accuracy. For a language model built on a list of business objects, we see an almost linear increase in productivity with a total logarithm of training data. To date, we have increased the indicator of correct recognition by 25% and increased the rate of successful connections by 35%.
1. INTRODUCTION
GOOG-411 [1] is a business object search service using voice. Users are prompted to name the city and state, and then the name of a particular business object or business category (for example, “computer stores”). The speech recognition system converts a voice user request into a query that is submitted to the Internet business object search system, Google Maps [2]. Google Maps returns a sorted list of businesses. Depending on how closely this matches the user's request, one to eight results of the query are issued using speech synthesis (TTS). Users can select a specific result, connect by phone with a business object, or request an SMS with information and a map. GOOG-411 currently works only in English and covers tens of thousands of cities throughout the United States.
The concept of voice help service 411 has been explored for quite a few years (see, for example, [3, 4, 5]), and has been implemented in various services, including 555 Tell [6], Live Search 411 [7] and Free 411 [8 ] in USA. It seems to us that GOOG-411 was one of the first implemented services 411, which included a full search by business objects and categories, and when processing difficult requests there was no switching to operators. Our main assumption with this choice was that by implementing an iterative approach to data processing and the corresponding indicators, the system will automatically improve over time. Having the ability to switch to the operator changes the way the user interacts with the system. To avoid this and focus on the final solution, we decided not to use operators from the very beginning. After a brief overview of the system architecture, we describe the data preparation and measurement process we are doing to improve GOOG-411. Then we focus more closely on the two key components, acoustic and language models, and conclude our consideration with a review of the high-level characteristics (UI) and their improvement over time.
')
2. SYSTEM ARCHITECTURE
Figure 1 shows the main components of the GOOG-411 system. They include a telephone network, an application server that runs voice applications, a TTS server, a recognition server with acoustic, language and phonetic models (AM, LM, PM), a Google Maps service for making business requests, and an SMS channel for transfer information to mobile users. Each of these components contains its own backup copy and load balancing capability, because this interactive system, many of which are asynchronous processes, is generally a rather complex structural entity. We use the Google infrastructure (machine grid, GFS [9], Bigtable [10]) for backup, automatic distribution; as well as multi-homed implementation of processes in order to ensure the reliability and scalability of the service. Current indicators are used to monitor the system, and in real time the newly received data allows us to control their quality.

Fig. 1. Flowchart GOOG-411
3. DATA PREPARATION AND MEASUREMENT PROCESS
An important aspect of our system is data optimization. To this end, we have created an extensive data preparation system. All incoming calls are analyzed to determine the viability of the system (checking for component failures, etc.) and their quality is monitored (for example, how much of the calls reached the end point in the dialogue). This data is then stored, decoded and used for further analysis, as well as for regrouping the main components of the system. Then this data is updated in the functioning system. At all times, new data is used for testing, the rest of the data is grouped for training sets. This test approach allows us to control the user interface and infrastructure changes, track changing usage patterns, and avoid using outdated test setups.
To assess the accuracy of recognition, our main indicator is the operating reception curves (ROC), which show the ratio of correctly recognized (correct-accept, CA) and falsely recognized (false-accept, FA) signals. They are evaluated at the sentence level in semantic interpretation of recognition results; for example, the recognition “um, Italian restaurant” instead of “Italian restaurant” is considered correct recognition (provided that the confidence coefficient exceeds a certain predetermined threshold, otherwise the hypothesis would be excluded).
At the system level, we measure the rate of successful connections (transfer rate), i.e. the proportion of calls at which users connect to enterprises or receive SMS with details of the query result. Somewhat simplifying, we can say that this indicator is in the first approximation a true indicator of user satisfaction. As shown in Chapter 6, it reflects user interface changes, improved infrastructure, and increasing accuracy.
Finally, at the product level, we monitor traffic changes, which is another indication of the success of this service. In the next two sections, we will look at our experiments in the field of acoustics and language modeling in more detail. When presenting results here and in Chapter 6, we deliberately avoid absolute value indicators, indicating only relative values instead. Partly due to competitive reasons, partly because absolute numbers easily become erroneous out of context. For example, absolute numbers depend on whether we save or eliminate sentences from the test sets that contain incomprehensible speech or silence, and how frequent they are. They also depend on whether a back-end search is included in the calculation. The rate of successful connections (transfer rate) depends on whether we include calls in the statistics when the user has hung up before saying anything. We hope that the relative indicators will nevertheless prove informative for the scientific community.
The experiments described below reflect the performance of our existing service, which interested readers can use by calling 1-800-GOOG-411 (1-800-466-4411). In general, the service received positive user reviews, demonstrating high accuracy of speech recognition (recognition level in the range of 50-80%), which makes it useful for users and comparable to commercial systems.
4. ACOUSTIC MODELS
The speech recognition system is a standard recognizer that works on a large dictionary, with PLP and LDA properties, based on GMM triphone HMMs, tree models, STC [11] and based on FST search [12]. In order to train the system, it is necessary to make the maximum possible optimization carried out in the framework mapreduce [13], which allows us to get ready-made models in a few hours, even with large amounts of data, currently on several hundred machines. Acoustic models that are compared in this section are independent of gender, are single-cycle and are trained exclusively on the speech patterns of the GOOG-411 service.

Fig. 2. Performance indicator depending on the amount of training acoustic data.
Figure 2 shows the relative effectiveness of a number of models that are trained on an increasing amount of data. The test consists of approximately 20,000 recently collected statements, in response to the question “Tell me the name of the company or category?” (“What is the business name or category?”), Covering more than 3,000 cities. The structure of acoustic and language models constantly pass through a series of experiments. The training sets are grouped so that we can present the results of all training materials that we collected in the first half, in the first quarter, in the first month, etc. The most extensive training sets contain a sample of thousands of hours of speech.
It is interesting to note that the quality of recognition does not increase dramatically with the amount of training data (8% of correct recognitions [CA] for 10% of false recognitions [FA] with a growth rate of training data 64). One of the reasons may be that the training data is qualitatively prepared for training sets both phonetically and acoustically (the same users with their requests can participate in both training the system and testing it, of course with different calls, but probably on the same device, and sometimes making the same request). Another reason may simply be that we have not studied this fact enough.
5. LANGUAGE MODELS
Language models are a combination of n-gram statistical linguistic models (SLM) and non-contextual (context-free) grammars. They are trained on three data sources, which makes it easy to optimize ROCs when processing data sets.
So, firstly, we have data on business objects and location: they provide the necessary coverage, but the official names of companies do not always coincide with what people call them, for example, “Google” vm. "Google Inc." or "Starbucks" vm. Starbucks coffee.
Secondly, we have logs of web requests to the Google Maps service: this is an extensive corpus of print requests that are best suited for the GOOG-411 service (users have already learned that you can enter “Google” or “Starbucks” to get the necessary answers ). Query data is used to determine LM likelihood, but their priority on Google Maps and GOOG-411 do not always match: for example, “real estate” [“real estate”] is a frequent web request, but a rare voice query.
Thirdly, we have a speech base: transcribed speech, collected through appeals to the GOOG-411 service, turns out to be the most appropriate type of data. In all the experiments below, language models are reduced to get closer to real-time recognition and limit the waiting time for the entire system.
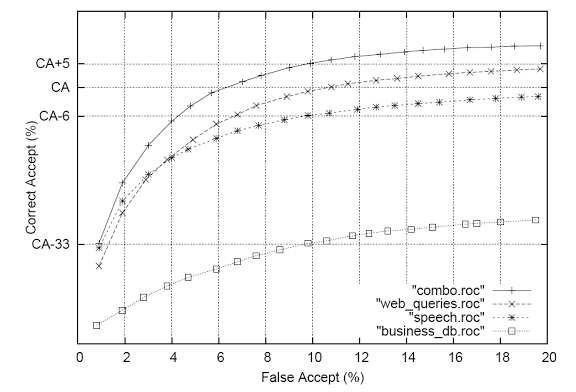
Fig. 3. Performance indicators depending on the type of LM data.
Figure 3 shows the performance of the system depending on the type of LM data. Currently, weblog data demonstrate that the best language models are those that are built on a speech basis, as a percentage of 6% of correct recognitions for 10% of incorrect recognitions between 2 LMs. Indicators according to business objects are much worse. The combination of 3 data sources (combo) gives an additional 5% of correct recognitions (on top of the web LM).
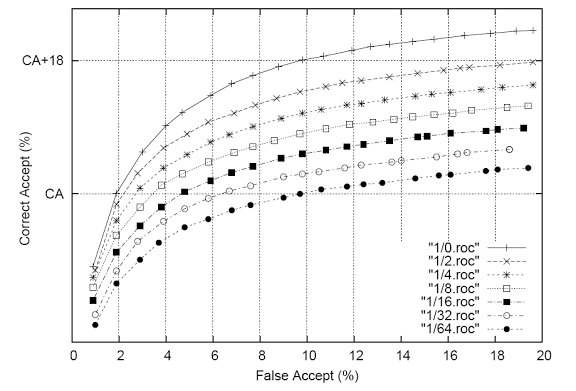
Fig. 4. LM performance indicators built on speech data as a function of the sum of LM training data.
Figure 4 shows the effectiveness of LM for business objects, obtained only on speech data, as a function of the volume of speech data. Here again, the training data is different by 2 points. Since the corresponding ROCs are located approximately equally, according to the training data log, we can conclude that the accuracy of the LM grows linearly. According to this indicator, the contribution of speech data will correspond to the contribution of (current) web requests only when we collect 4 times more speech data (even though it will still be an order of magnitude smaller than the amount of web data).

Fig. 5. Performance indicators, as a function of the type and amount of LM training data.
Figure 5 shows the effectiveness of the “askCityState” dialog, depending on the type (web, speech, combined) and the size of the speech LM training data. Being a simple task, askCityState increases less linearly. Here, speech data acts in the same way as web-data, which was significantly processed to separate cities and states from requests, with a variety of indicators (full street addresses, etc.). Without such processing, web data showed a very large deviation of indicators. The combination of voice and (processed) web-data provides the best quality of recognition. Object and location databases did not provide any additional benefits.
6. GENERAL DIRECTIONS OF IMPROVEMENT
This section provides a general view of the evolution of GOOG-411 over time. Many factors influence the structure of the use of this service, including changes in statistical models, changes in the user interface, changes in the internal structure of the service, correction of errors, as well as external events, such as holidays, for example.
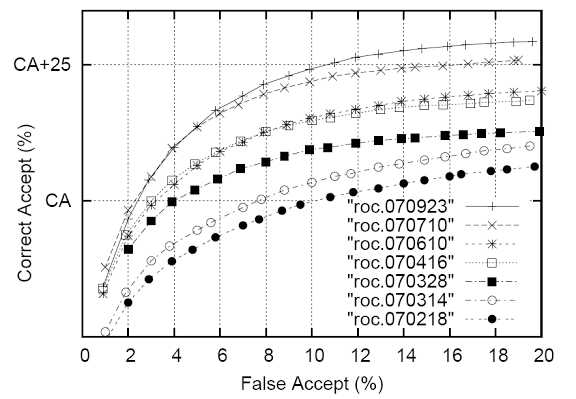
Fig. 6. Performance indicators for all time.
Figure 6 shows the recognition function in time. Each ROC was collected on different test sets (see test concept described in section 3). These numbers show that at a rate of 10% correct recognition in the last 7 months, we improved it by about 25%.
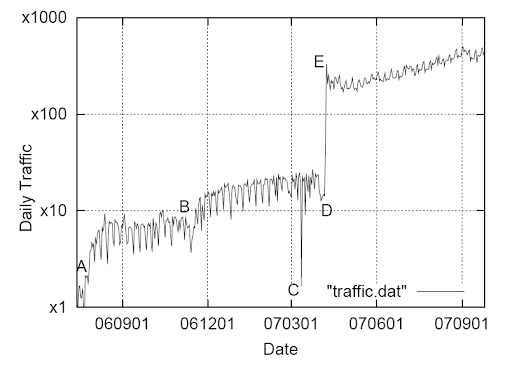
Fig. 7. Day traffic as a temporary function
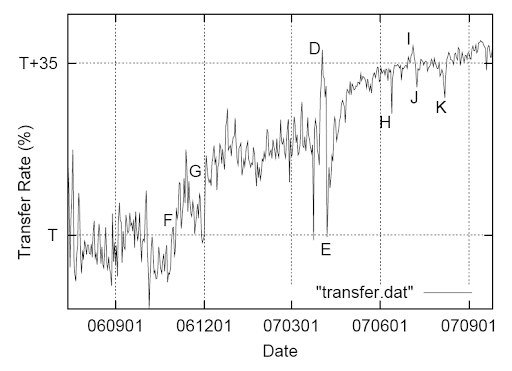
Fig. 8. The rate of successful connections depending on time.
Figures 7 and 8 show the number of incoming calls per day, as well as the daily rate of successful connections for one year. Here are some interesting points. Points A and B in the graph show the growth of traffic at the time of the increase in our advertising campaign. Point C - a temporary interruption in the system. Point E on both graphs marks the official start of the GOOG-411 service with a large increase in traffic volume, as well as a large drop in the success rate of connections: users are experimenting with the system and are not trying to reach companies. Point D corresponds to the quiet period before the official launch: we stopped advertising the service (reduced call rates), so the subscribers were mostly users who, for the intended purpose, contacted this service (peak of the successful connection rate).
Point F on the graph of successful connections marks the beginning of the experiment with the user interface, where we have reduced the results of issuing users. This provokes people to call companies more often. Point G marks the spread of service to all states of America. Point H shows an interesting error when parts of callers were provided with incorrect results for a significant number of queries. This was reflected in the fall in the success rate of connections. Points J and K show telephony infrastructure failures, which also cause a drop in the success rate of connections. Point I is July 4 [Independence Day], the day when users were probably more interested in connecting with business objects for shopping.
We could analyze the curves in more detail. But it is obvious that neither traffic, nor connection indicators will tell us everything about users, despite the fact that they reflect a surprisingly broad aspect of events and prove to be very useful for monitoring the operation and development of the system. There is a lot of noise in the curves, which are the result of a number of difficult to determine factors. This complicates on-line experiments. Of course, there may be a slight change in the user interface, but its effect on the success rate of successful connections is not clear, although it will undoubtedly appear eventually. To do this, we must count on finding more fractional indicators, and ultimately believe that we are doing everything for the better, just as we believe when we optimize recognition models.
7. CONCLUSION
So, we used an iterative approach to create, use and develop a rather complex system based on voice queries. We showed how, by focusing on data, measurements, and continually improving the system, we can quickly improve low-level indicators, such as speech recognition accuracy, as well as high-level user-related characteristics. In general, we have found that having access to the entire product stack with the ability to flexibly change it at will, as well as having a steady stream of increasing data are key factors in our ability to consistently improve service over time.
8. LINKS
[1] “GOOG-411” http://www.google.com/goog411 .
[2] “Google Maps” http://maps.google.com .
[3] L. Boves et al., “ASR for automatic directory assistance: The SMADA project” in Proc. ASR, 2000, pp. 249–254.
[4] N. Gupta et al., “The AT & T spoken language understanding system” in IEEE Trans. ASLP, 2006, pp. 213–222.
[5] D. Yu et al., “Automated directory assistance - from theory to practice” Proc. Interspeech, 2007.
[6] “555 Tell” http://www.tellme.com/products/TellmeByVoice .
[7] “Live search 411” http://www.livesearch411.com .
[8] “Free 411” http://www.free411.com .
[9] S. Ghemawat et al., “The google file system” in Proc. SIGOPS, 2003, pp. 20–43.
[10] F. Chang et al., “Bigtable: A distributed storage system for structured data” in Proc. OSDI, 2006, pp. 205-218.
[11] MJF Gales “Semi-tied covariance matrices for hidden markov models” Proc. IEEE Trans. SAP, May 2000.
[12] “OpenFst Library” http://www.openfst.org .
[13] J. Dean et al., “Mapreduce: Simplified data processing on large clusters,” in Proc.OSDI, 2004, pp. 137–150.
Perhaps, for the sake of completeness, I’ll give a link to a video in which Bill Byrne talks about the voice line of Google services .
ANNOTATION
We describe our first experience in developing and optimizing GOOG-411, a fully automated business search using voice. We show how the adoption of an iterative approach to system design allows us to optimize the various components of the system, thus gradually improving the performance with which users interact. We show the contribution of various data sources to recognition accuracy. For a language model built on a list of business objects, we see an almost linear increase in productivity with a total logarithm of training data. To date, we have increased the indicator of correct recognition by 25% and increased the rate of successful connections by 35%.
1. INTRODUCTION
GOOG-411 [1] is a business object search service using voice. Users are prompted to name the city and state, and then the name of a particular business object or business category (for example, “computer stores”). The speech recognition system converts a voice user request into a query that is submitted to the Internet business object search system, Google Maps [2]. Google Maps returns a sorted list of businesses. Depending on how closely this matches the user's request, one to eight results of the query are issued using speech synthesis (TTS). Users can select a specific result, connect by phone with a business object, or request an SMS with information and a map. GOOG-411 currently works only in English and covers tens of thousands of cities throughout the United States.
The concept of voice help service 411 has been explored for quite a few years (see, for example, [3, 4, 5]), and has been implemented in various services, including 555 Tell [6], Live Search 411 [7] and Free 411 [8 ] in USA. It seems to us that GOOG-411 was one of the first implemented services 411, which included a full search by business objects and categories, and when processing difficult requests there was no switching to operators. Our main assumption with this choice was that by implementing an iterative approach to data processing and the corresponding indicators, the system will automatically improve over time. Having the ability to switch to the operator changes the way the user interacts with the system. To avoid this and focus on the final solution, we decided not to use operators from the very beginning. After a brief overview of the system architecture, we describe the data preparation and measurement process we are doing to improve GOOG-411. Then we focus more closely on the two key components, acoustic and language models, and conclude our consideration with a review of the high-level characteristics (UI) and their improvement over time.
')
2. SYSTEM ARCHITECTURE
Figure 1 shows the main components of the GOOG-411 system. They include a telephone network, an application server that runs voice applications, a TTS server, a recognition server with acoustic, language and phonetic models (AM, LM, PM), a Google Maps service for making business requests, and an SMS channel for transfer information to mobile users. Each of these components contains its own backup copy and load balancing capability, because this interactive system, many of which are asynchronous processes, is generally a rather complex structural entity. We use the Google infrastructure (machine grid, GFS [9], Bigtable [10]) for backup, automatic distribution; as well as multi-homed implementation of processes in order to ensure the reliability and scalability of the service. Current indicators are used to monitor the system, and in real time the newly received data allows us to control their quality.
Fig. 1. Flowchart GOOG-411
3. DATA PREPARATION AND MEASUREMENT PROCESS
An important aspect of our system is data optimization. To this end, we have created an extensive data preparation system. All incoming calls are analyzed to determine the viability of the system (checking for component failures, etc.) and their quality is monitored (for example, how much of the calls reached the end point in the dialogue). This data is then stored, decoded and used for further analysis, as well as for regrouping the main components of the system. Then this data is updated in the functioning system. At all times, new data is used for testing, the rest of the data is grouped for training sets. This test approach allows us to control the user interface and infrastructure changes, track changing usage patterns, and avoid using outdated test setups.
To assess the accuracy of recognition, our main indicator is the operating reception curves (ROC), which show the ratio of correctly recognized (correct-accept, CA) and falsely recognized (false-accept, FA) signals. They are evaluated at the sentence level in semantic interpretation of recognition results; for example, the recognition “um, Italian restaurant” instead of “Italian restaurant” is considered correct recognition (provided that the confidence coefficient exceeds a certain predetermined threshold, otherwise the hypothesis would be excluded).
At the system level, we measure the rate of successful connections (transfer rate), i.e. the proportion of calls at which users connect to enterprises or receive SMS with details of the query result. Somewhat simplifying, we can say that this indicator is in the first approximation a true indicator of user satisfaction. As shown in Chapter 6, it reflects user interface changes, improved infrastructure, and increasing accuracy.
Finally, at the product level, we monitor traffic changes, which is another indication of the success of this service. In the next two sections, we will look at our experiments in the field of acoustics and language modeling in more detail. When presenting results here and in Chapter 6, we deliberately avoid absolute value indicators, indicating only relative values instead. Partly due to competitive reasons, partly because absolute numbers easily become erroneous out of context. For example, absolute numbers depend on whether we save or eliminate sentences from the test sets that contain incomprehensible speech or silence, and how frequent they are. They also depend on whether a back-end search is included in the calculation. The rate of successful connections (transfer rate) depends on whether we include calls in the statistics when the user has hung up before saying anything. We hope that the relative indicators will nevertheless prove informative for the scientific community.
The experiments described below reflect the performance of our existing service, which interested readers can use by calling 1-800-GOOG-411 (1-800-466-4411). In general, the service received positive user reviews, demonstrating high accuracy of speech recognition (recognition level in the range of 50-80%), which makes it useful for users and comparable to commercial systems.
4. ACOUSTIC MODELS
The speech recognition system is a standard recognizer that works on a large dictionary, with PLP and LDA properties, based on GMM triphone HMMs, tree models, STC [11] and based on FST search [12]. In order to train the system, it is necessary to make the maximum possible optimization carried out in the framework mapreduce [13], which allows us to get ready-made models in a few hours, even with large amounts of data, currently on several hundred machines. Acoustic models that are compared in this section are independent of gender, are single-cycle and are trained exclusively on the speech patterns of the GOOG-411 service.
Fig. 2. Performance indicator depending on the amount of training acoustic data.
Figure 2 shows the relative effectiveness of a number of models that are trained on an increasing amount of data. The test consists of approximately 20,000 recently collected statements, in response to the question “Tell me the name of the company or category?” (“What is the business name or category?”), Covering more than 3,000 cities. The structure of acoustic and language models constantly pass through a series of experiments. The training sets are grouped so that we can present the results of all training materials that we collected in the first half, in the first quarter, in the first month, etc. The most extensive training sets contain a sample of thousands of hours of speech.
It is interesting to note that the quality of recognition does not increase dramatically with the amount of training data (8% of correct recognitions [CA] for 10% of false recognitions [FA] with a growth rate of training data 64). One of the reasons may be that the training data is qualitatively prepared for training sets both phonetically and acoustically (the same users with their requests can participate in both training the system and testing it, of course with different calls, but probably on the same device, and sometimes making the same request). Another reason may simply be that we have not studied this fact enough.
5. LANGUAGE MODELS
Language models are a combination of n-gram statistical linguistic models (SLM) and non-contextual (context-free) grammars. They are trained on three data sources, which makes it easy to optimize ROCs when processing data sets.
So, firstly, we have data on business objects and location: they provide the necessary coverage, but the official names of companies do not always coincide with what people call them, for example, “Google” vm. "Google Inc." or "Starbucks" vm. Starbucks coffee.
Secondly, we have logs of web requests to the Google Maps service: this is an extensive corpus of print requests that are best suited for the GOOG-411 service (users have already learned that you can enter “Google” or “Starbucks” to get the necessary answers ). Query data is used to determine LM likelihood, but their priority on Google Maps and GOOG-411 do not always match: for example, “real estate” [“real estate”] is a frequent web request, but a rare voice query.
Thirdly, we have a speech base: transcribed speech, collected through appeals to the GOOG-411 service, turns out to be the most appropriate type of data. In all the experiments below, language models are reduced to get closer to real-time recognition and limit the waiting time for the entire system.
Fig. 3. Performance indicators depending on the type of LM data.
Figure 3 shows the performance of the system depending on the type of LM data. Currently, weblog data demonstrate that the best language models are those that are built on a speech basis, as a percentage of 6% of correct recognitions for 10% of incorrect recognitions between 2 LMs. Indicators according to business objects are much worse. The combination of 3 data sources (combo) gives an additional 5% of correct recognitions (on top of the web LM).
Fig. 4. LM performance indicators built on speech data as a function of the sum of LM training data.
Figure 4 shows the effectiveness of LM for business objects, obtained only on speech data, as a function of the volume of speech data. Here again, the training data is different by 2 points. Since the corresponding ROCs are located approximately equally, according to the training data log, we can conclude that the accuracy of the LM grows linearly. According to this indicator, the contribution of speech data will correspond to the contribution of (current) web requests only when we collect 4 times more speech data (even though it will still be an order of magnitude smaller than the amount of web data).
Fig. 5. Performance indicators, as a function of the type and amount of LM training data.
Figure 5 shows the effectiveness of the “askCityState” dialog, depending on the type (web, speech, combined) and the size of the speech LM training data. Being a simple task, askCityState increases less linearly. Here, speech data acts in the same way as web-data, which was significantly processed to separate cities and states from requests, with a variety of indicators (full street addresses, etc.). Without such processing, web data showed a very large deviation of indicators. The combination of voice and (processed) web-data provides the best quality of recognition. Object and location databases did not provide any additional benefits.
6. GENERAL DIRECTIONS OF IMPROVEMENT
This section provides a general view of the evolution of GOOG-411 over time. Many factors influence the structure of the use of this service, including changes in statistical models, changes in the user interface, changes in the internal structure of the service, correction of errors, as well as external events, such as holidays, for example.
Fig. 6. Performance indicators for all time.
Figure 6 shows the recognition function in time. Each ROC was collected on different test sets (see test concept described in section 3). These numbers show that at a rate of 10% correct recognition in the last 7 months, we improved it by about 25%.
Fig. 7. Day traffic as a temporary function
Fig. 8. The rate of successful connections depending on time.
Figures 7 and 8 show the number of incoming calls per day, as well as the daily rate of successful connections for one year. Here are some interesting points. Points A and B in the graph show the growth of traffic at the time of the increase in our advertising campaign. Point C - a temporary interruption in the system. Point E on both graphs marks the official start of the GOOG-411 service with a large increase in traffic volume, as well as a large drop in the success rate of connections: users are experimenting with the system and are not trying to reach companies. Point D corresponds to the quiet period before the official launch: we stopped advertising the service (reduced call rates), so the subscribers were mostly users who, for the intended purpose, contacted this service (peak of the successful connection rate).
Point F on the graph of successful connections marks the beginning of the experiment with the user interface, where we have reduced the results of issuing users. This provokes people to call companies more often. Point G marks the spread of service to all states of America. Point H shows an interesting error when parts of callers were provided with incorrect results for a significant number of queries. This was reflected in the fall in the success rate of connections. Points J and K show telephony infrastructure failures, which also cause a drop in the success rate of connections. Point I is July 4 [Independence Day], the day when users were probably more interested in connecting with business objects for shopping.
We could analyze the curves in more detail. But it is obvious that neither traffic, nor connection indicators will tell us everything about users, despite the fact that they reflect a surprisingly broad aspect of events and prove to be very useful for monitoring the operation and development of the system. There is a lot of noise in the curves, which are the result of a number of difficult to determine factors. This complicates on-line experiments. Of course, there may be a slight change in the user interface, but its effect on the success rate of successful connections is not clear, although it will undoubtedly appear eventually. To do this, we must count on finding more fractional indicators, and ultimately believe that we are doing everything for the better, just as we believe when we optimize recognition models.
7. CONCLUSION
So, we used an iterative approach to create, use and develop a rather complex system based on voice queries. We showed how, by focusing on data, measurements, and continually improving the system, we can quickly improve low-level indicators, such as speech recognition accuracy, as well as high-level user-related characteristics. In general, we have found that having access to the entire product stack with the ability to flexibly change it at will, as well as having a steady stream of increasing data are key factors in our ability to consistently improve service over time.
8. LINKS
[1] “GOOG-411” http://www.google.com/goog411 .
[2] “Google Maps” http://maps.google.com .
[3] L. Boves et al., “ASR for automatic directory assistance: The SMADA project” in Proc. ASR, 2000, pp. 249–254.
[4] N. Gupta et al., “The AT & T spoken language understanding system” in IEEE Trans. ASLP, 2006, pp. 213–222.
[5] D. Yu et al., “Automated directory assistance - from theory to practice” Proc. Interspeech, 2007.
[6] “555 Tell” http://www.tellme.com/products/TellmeByVoice .
[7] “Live search 411” http://www.livesearch411.com .
[8] “Free 411” http://www.free411.com .
[9] S. Ghemawat et al., “The google file system” in Proc. SIGOPS, 2003, pp. 20–43.
[10] F. Chang et al., “Bigtable: A distributed storage system for structured data” in Proc. OSDI, 2006, pp. 205-218.
[11] MJF Gales “Semi-tied covariance matrices for hidden markov models” Proc. IEEE Trans. SAP, May 2000.
[12] “OpenFst Library” http://www.openfst.org .
[13] J. Dean et al., “Mapreduce: Simplified data processing on large clusters,” in Proc.OSDI, 2004, pp. 137–150.
Perhaps, for the sake of completeness, I’ll give a link to a video in which Bill Byrne talks about the voice line of Google services .
Source: https://habr.com/ru/post/64940/
All Articles