Quick Logging
It was necessary here to track the current state of the frequently changing element. There was a suspicion that someone would reset it. Immediately he dismissed the options with writing logging through the file system: Silverlight is not allowed to write where he wants. Therefore, a small extensibility method was written that displays debug information in the browser console.
Called is very simple: on the object you just need to call the Log () method.
I usually prepare a string and log it.
')
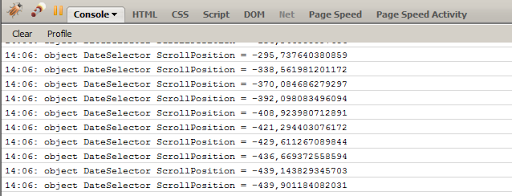
This is how it looks in FireFox (you need a FireBug to view):
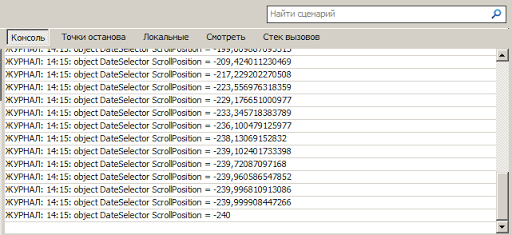
and this is in IE8 (you just need to press F12 and go to the Script tab):
This method is suitable if you need to look at something in the project while debugging. For long-term logging, it's better to use Clog, of course. That's just it does not support Silverlight 3.
public static class Extensions
{
public static void Log( this object obj)
{
HtmlWindow window = HtmlPage.Window;
object isConsoleAvailable =
window.Eval( "typeof(console) != 'undefined' && typeof(console.log) != 'undefined'" );

if ( (isConsoleAvailable is bool ) && ( bool )isConsoleAvailable)
{
var console = (window.Eval( "console.log" ) as ScriptObject);
if (console != null )
{
console.InvokeSelf(obj);
}
}
}
}

* This source code was highlighted with Source Code Highlighter .
Called is very simple: on the object you just need to call the Log () method.
I usually prepare a string and log it.
string message = string .Format( "{0}: object {1} ScrollPosition = {2}" , DateTime .Now.ToShortTimeString(),((ItemsControl)d).Name,e.NewValue.ToString());
message.Log();

* This source code was highlighted with Source Code Highlighter .
')
This is how it looks in FireFox (you need a FireBug to view):
and this is in IE8 (you just need to press F12 and go to the Script tab):
This method is suitable if you need to look at something in the project while debugging. For long-term logging, it's better to use Clog, of course. That's just it does not support Silverlight 3.
Source: https://habr.com/ru/post/64062/
All Articles