Thought Scheduling Charts
The Mind Map tool is quite new: so much so that it doesn’t even have an established Russian name. It is usually called mind maps, memory cards, consciousness or brain maps, and even mental maps. As for me, quite cumbersome and inconvenient names in which, most importantly, the essence of the concept is not clearly conveyed (I hear some anatomical shades: here the left hemisphere, right here, and then the cerebellum ... :) this, if simplified as much as possible, is pictures depicting concepts and logical connections between them. One could say concept cards, but it also sounds cumbersome, but thought cards are simpler. Well, following the tradition of word formation in the Russian language: thoughtmaps! [ 1 ]
Thought cards help to better understand some complex and / or multi-system components by connecting a visual perception channel and, accordingly, figurative thinking. It is said that, on average, a person can keep in memory only 7 separate objects. But this is if these objects are weakly connected in consciousness with each other. But if you add associations, then the potential for working with them in your mind and memorizing is incredibly expanding. The book "Fundamentals of Practice on the Piano" states that it is on this that the methods of people practicing photographic memory are built ...
But I digress. What do thoughts of personal finance? Apart from, of course, the fact that both of these phenomena somehow concern the topic of personal development :), the connection was suggested to us by one of the users of our finance accounting service [ 2 ]. And what if you apply these cards to planning expenses for the near future? For example, you can think of expenses that can potentially go beyond the family budget, but to understand this, you need to sit with a pencil and notebook and estimate your future expenses and income, add the ingredients of savings and unplanned expenses, and a pinch of luck, and get a forecast at the output , whether it is possible to carry out the planned. In general, the accounting system may well help in this: after all, it already has almost all the necessary information. Another question is that it needs to be shown so that a person does not drown in this ocean of numbers. This is where the clarity and simplicity of the mindcards comes to the rescue. But, as they say, “it’s better to see once than to hear a hundred times,” so I’ll try to show what I mean.
')
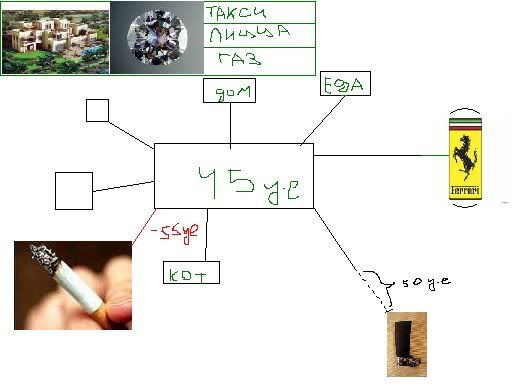
This is how the original sketch sent to me looked like:

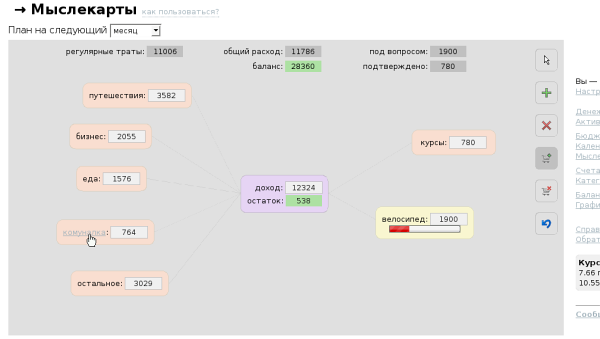
But this was our first implementation:

I will try to briefly describe her work. Now you can plan in the time horizons of the month, quarter and year. For the user for the previous period ending today, his expenses and revenues are calculated. These amounts are the forecast for the planning period. Based on this forecast, as well as the current balance, the balance forecast is considered at the end of the term, and the difference between the planned income and expenses is the accumulated / spent balance specifically for the period. Since our maps serve primarily for planning expenses [ 3 ], expenditures are divided into several largest categories. A person can estimate for which of them something will change (for example, you can save money) and make these changes directly to the map. Some categories can be removed altogether. (In addition, you can follow the link and look at all the expenses for each category). Naturally, all changes are immediately reflected in the amounts of expenditure, balance and balance. You can also change the expected income. A person can add his plans to the map and immediately see how much of the balance of money for the period is enough to cover each of them individually, as well as their total amount. Finally, having decided on some of the plans, you can “add them to the basket” (confirm). And only then will they contribute to the amount of expenses for the period. Actually, this is all for now.
It is worth noting that in this case, we have not quite a classic thought-card: so far we have not implemented the display of the subcategories at the user's discretion, although this is probably not essential. It seems that there is no great value in this information, but it is quite capable of making the card overloaded.
As for the technical side, this is a topic for an article in another blog. I will only note that the map is fully implemented in JavaScript, the irreplaceable jQuery library performed with handy material (I take my words back: this is not a crutch :). Of course, the big drawback of using DOM exclusively is the inability to depict arbitrary objects: probably a couple of years you will have to use different hacks until the CANVAS tag becomes ubiquitous. In this case, for example, instead of drawing lines, scalable ready-made images are shown. This allows you to achieve a relatively small load on the browser, but sometimes leads to mini hangs (at the time of switching between pictures).
In general, I don’t know, of course, whether this function will become a really useful tool for managing your budget or will it remain just a beautiful toy. Hope to see examples of the first. For me, it became an interesting experiment in visualizing financial information. Perhaps this method is applicable in other financial areas, for example, in the enterprise’s management reporting systems or programs for exchange traders. What do you think?
[0] LiveJournal community on thoughtmaps
[1] And, in scientific terms, they probably can be attributed to semantic networks.
[2] It's nice that in this regard, what I wrote in the announcement of fin-ack.com comes true : many interesting ideas come from users
[3] However, nothing prevents you from using them for income planning or something else.
Thought cards help to better understand some complex and / or multi-system components by connecting a visual perception channel and, accordingly, figurative thinking. It is said that, on average, a person can keep in memory only 7 separate objects. But this is if these objects are weakly connected in consciousness with each other. But if you add associations, then the potential for working with them in your mind and memorizing is incredibly expanding. The book "Fundamentals of Practice on the Piano" states that it is on this that the methods of people practicing photographic memory are built ...
But I digress. What do thoughts of personal finance? Apart from, of course, the fact that both of these phenomena somehow concern the topic of personal development :), the connection was suggested to us by one of the users of our finance accounting service [ 2 ]. And what if you apply these cards to planning expenses for the near future? For example, you can think of expenses that can potentially go beyond the family budget, but to understand this, you need to sit with a pencil and notebook and estimate your future expenses and income, add the ingredients of savings and unplanned expenses, and a pinch of luck, and get a forecast at the output , whether it is possible to carry out the planned. In general, the accounting system may well help in this: after all, it already has almost all the necessary information. Another question is that it needs to be shown so that a person does not drown in this ocean of numbers. This is where the clarity and simplicity of the mindcards comes to the rescue. But, as they say, “it’s better to see once than to hear a hundred times,” so I’ll try to show what I mean.
')
This is how the original sketch sent to me looked like:

But this was our first implementation:

I will try to briefly describe her work. Now you can plan in the time horizons of the month, quarter and year. For the user for the previous period ending today, his expenses and revenues are calculated. These amounts are the forecast for the planning period. Based on this forecast, as well as the current balance, the balance forecast is considered at the end of the term, and the difference between the planned income and expenses is the accumulated / spent balance specifically for the period. Since our maps serve primarily for planning expenses [ 3 ], expenditures are divided into several largest categories. A person can estimate for which of them something will change (for example, you can save money) and make these changes directly to the map. Some categories can be removed altogether. (In addition, you can follow the link and look at all the expenses for each category). Naturally, all changes are immediately reflected in the amounts of expenditure, balance and balance. You can also change the expected income. A person can add his plans to the map and immediately see how much of the balance of money for the period is enough to cover each of them individually, as well as their total amount. Finally, having decided on some of the plans, you can “add them to the basket” (confirm). And only then will they contribute to the amount of expenses for the period. Actually, this is all for now.
It is worth noting that in this case, we have not quite a classic thought-card: so far we have not implemented the display of the subcategories at the user's discretion, although this is probably not essential. It seems that there is no great value in this information, but it is quite capable of making the card overloaded.
As for the technical side, this is a topic for an article in another blog. I will only note that the map is fully implemented in JavaScript, the irreplaceable jQuery library performed with handy material (I take my words back: this is not a crutch :). Of course, the big drawback of using DOM exclusively is the inability to depict arbitrary objects: probably a couple of years you will have to use different hacks until the CANVAS tag becomes ubiquitous. In this case, for example, instead of drawing lines, scalable ready-made images are shown. This allows you to achieve a relatively small load on the browser, but sometimes leads to mini hangs (at the time of switching between pictures).
In general, I don’t know, of course, whether this function will become a really useful tool for managing your budget or will it remain just a beautiful toy. Hope to see examples of the first. For me, it became an interesting experiment in visualizing financial information. Perhaps this method is applicable in other financial areas, for example, in the enterprise’s management reporting systems or programs for exchange traders. What do you think?
[0] LiveJournal community on thoughtmaps
[1] And, in scientific terms, they probably can be attributed to semantic networks.
[2] It's nice that in this regard, what I wrote in the announcement of fin-ack.com comes true : many interesting ideas come from users
[3] However, nothing prevents you from using them for income planning or something else.
Source: https://habr.com/ru/post/60388/
All Articles