Debug in Zend Framework using FirePHP

There is one rule - do not show debug information to the customer, for this purpose there are usually two configurations, but if the customer is very curious, do you want to hide kilobytes of information debugging for aesthetic reasons? FirePHP will help us with these good intentions.
For those who don't know, FirePHP is an extension of the FireBug plugin for Mozilla Firefox.
')
For this purpose, we need in your Zend Framewrok project to slightly change the bootsrap.php and add a couple of files to the library. I'll start with a simple one - change the bootstrap:
// insert this piece of code after loading the config file
{
// variable from the config that is responsible for displaying debug information
if ( $ config -> application -> debug ) {
/ * Turn on all errors and STRICT notices * /
error_reporting ( E_ALL | E_STRICT ) ;
ini_set ( 'display_errors' , 1 ) ;
ini_set ( 'display_startup_errors' , 1 ) ;
require_once 'Core / Debug.php' ; // connect the Core_Debug class - what does it read next
Core_Debug :: setEnabled ( true ) ;
Core_Debug :: getGenerateTime ( 'Begin' ) ;
} else {
/ * Turn off all errors * /
error_reporting ( 0 ) ;
ini_set ( 'display_errors' , 0 ) ;
ini_set ( 'display_startup_errors' , 0 ) ;
}
}
// this is enabled after adapter DB initialization
{
// something like this
$ dbAdapter = Zend_Db :: factory ( $ config -> database ) ;
// connect profiler
if ( $ config -> application -> debug ) {
require_once 'Core / Db / Profiler.php' ; // connect Core_Db_Profiler - this is not a standard profile profiler
$ profiler = new Core_Db_Profiler ( 'Profiler' ) ;
$ profiler -> setEnabled ( true ) ;
$ dbAdapter -> setProfiler ( $ profiler ) ;
}
}
Now for the tasty ...
DB_Profiler
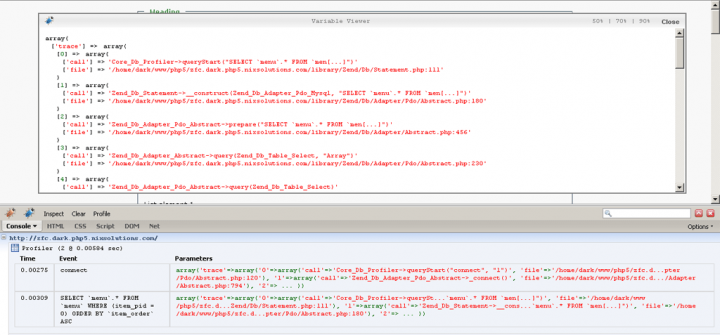
Core_Db_Profiler (although by all rules it should be called Core_Db_Profiler_Firebug) is a class for debugging the application's work with the database (see Zend DB Profiler ), it is inherited from Zend_Db_Profiler_Firebug , it contains only one change - the backtrace is added, because It is very useful to know where a particular database request was made from.
It looks like this (clickable):

Debug
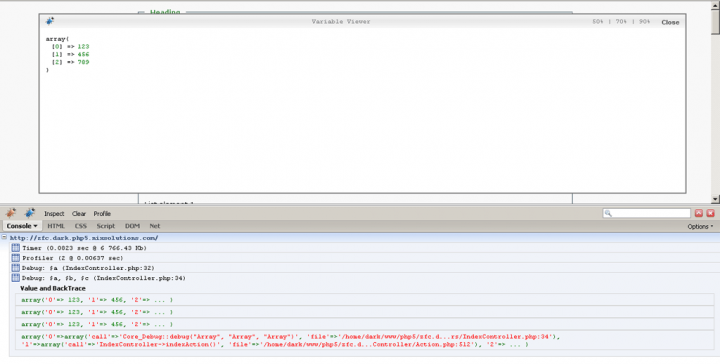
The Core_Debug class inherits from Zend_Debug and extends its functionality for working with FirePHP, the debug function is added, which displays information about variables (s) in the Fire Bug console, I will give an example of PHP code:
$ a = $ b = $ c = array ( 123 , 456 , 789 ) ;
Core_Debug :: debug ( $ a ) ; // print one variable
Core_Debug :: debug ( $ a , $ b , $ c ) ; // print several variables
The result can be seen in the console:

The last line displays backtrace - so that there are no problems with finding the line where you invoke debug. But there is one problem with this debug method - if there is too much data, the browser will simply freeze, trying to execute JavaScript.
There is another useful function in the Core_Debug class - it is called getGenerateTime - we called it right after connecting Core_Debug - the main task of this function is to leave timestamps by code, i.e. we call the method for the first time - the call time is saved, we call the second - we save (deduce) the difference between the previous and the first call. I will give the following example, I have three calls in my code:
// immediately after connecting Core_Debug
require_once 'Core / Debug.php' ;
Core_Debug :: setEnabled ( true ) ;
Core_Debug :: getGenerateTime ( 'Begin' ) ;
/ * ... * /
// Index Action in Index Controller
Core_Debug :: getGenerateTime ( 'IndexAction' ) ;
/ * ... * /
// before dispute
Core_Debug :: getGenerateTime ( 'Before Dispatch' ) ;
Zend_Controller_Front :: getInstance ( ) -> dispatch ( ) ;
The result will again be the FireBug console:

Where:
- Time (sec) - time from the previous "notch"
- Total (sec) - time from the first "notch"
- Memory (Kb) - amount of memory eaten from the previous "notch"
- Total (Kb) - the amount of eaten memory for all time
These classes can be downloaded from the following link: FirePHP Debug (2.5 Kb)
Related Links:
PS Thanks Baziak 'u for the idea ...
Link to article in my blog: Debug in Zend Framework using FirePHP
Source: https://habr.com/ru/post/58817/
All Articles