Phase development speed measurement
A classic example of assessing the current state of a project is the burndown chart - objectively, the best tool that allows you to see the real state of affairs in the iteration.
But it turns out, and it can be improved - to additionally measure the speed of development by design phases: requirements analysis, development, testing, documentation, etc.
For a 100% cross-functional team, where the developer = tester = analyst, this is probably not so important - if the analysis of requirements does not have time, the rest will spread and help. But how many such teams do you know?
(further reason, adopting the effectiveness of analytical activities 1 developer less effective than the same activity 1 analyst)
')
Let's imagine that we have a weekly iteration, in a team other than developers, there is only one analyst for 4 hours a day - a total of 20 available hours. But the analysis tasks turned out to be at 30 hours (for example, they were underestimated) - and everything must be done to start the next iteration well.
In this situation, the burndown will show us that everything is fine (for example, developers go faster than the plan), however, it is obvious that the analysis will not be completed on time.
And burndown continues to show that everything is normal!
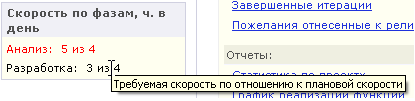
This is where another indicator will help, the required development speed in phases - if we have more work left, for example for analysis, more than physically available time for analysts, a red light will come on and we will have to pay attention to it in time.
For example, in DEVPROM, such an indicator is measured and is always available to the team near the burndown schedule.
Source: https://habr.com/ru/post/57899/
All Articles