MS Chart: an example of performance counters with 3D rotation
At one of the User Group meetings, I told the report “Creating Charts Using MS Chart”, for which I made an example of the WinForms performance counter application, which displays information about 3 system indicators in real time: processor load, physical and virtual memory usage, and also 3D rotation capability. I do not know if this example would be useful to anyone, but I decided to tell about it.
First, a few words about MS Chart: this is an addition to the Microsoft .NET Framework 3.5 SP1, which allows you to create diagrams in WinForms applications (which gives us both WPF) and WebForms. In the future, this will be part of the Microsoft .NET Framework 4. MS Chart was not created from scratch, but was taken from the Dundas library ( source ).
In order to start working with MS Chart, you need to install MS Chart Controls components. You can download them at the following links:
I would also like to say that the examples are much richer than the documentation on these controls, therefore it is better to see the examples right away than read the documentation itself.
')
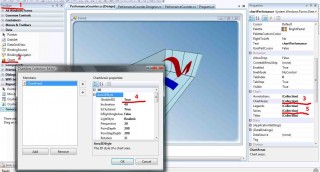
So, we installed MS Chart. Create a new WinForms project. Put on him control Chart. Set the Area Area3DStyle.Enabled3D property to true. We put 3 Series sets with Spline types (this is one of the types of graphs that allows you to put several graphs on one Area). In summary, we have some idea that we can fill out with information. Then you can adjust the appearance of the graphs, colors and much more, which I did.
Next we need to create 3 PerfomanceCounter objects from the System.Diagnostics namespace:
Now add the rotation logic:
All three methods need to be attached to the Chart object on the MouseMove, MouseDown and MouseUp events, respectively.
As a result, we should have the following result:
Here is a simple example of working with MS Chart. I want to say that this is quite a powerful library that provides the ability to present data in the form of graphs. And of the free analogues, probably the best. True, I know only one free analogue - ZedGraph , and before the advent of MS Chart I used it only. Not to say that MS Chart brought more functionality, but it has the ability to place smart signatures (so that they do not climb on each other), methods for calculating financial formulas (medians and much more), displaying legends and many more.
At the end I want to give a few links where you can still get information about MS Chart:
Download an example ...
First, a few words about MS Chart: this is an addition to the Microsoft .NET Framework 3.5 SP1, which allows you to create diagrams in WinForms applications (which gives us both WPF) and WebForms. In the future, this will be part of the Microsoft .NET Framework 4. MS Chart was not created from scratch, but was taken from the Dundas library ( source ).
In order to start working with MS Chart, you need to install MS Chart Controls components. You can download them at the following links:
- Microsoft Chart Controls for Microsoft .NET Framework 3.5 (controls themselves)
- Microsoft Chart Controls Add-on for Microsoft Visual Studio 2008 (add-on for working with controls in MS Visual Studio 2008)
- Microsoft Chart Controls Samples (Usage Examples)
- Microsoft Chart Controls for .NET Framework Documentation (Documentation)
- Microsoft Chart Controls for Microsoft .NET Framework 3.5 Language Pack (Russification, or ... well, in total about 23 different languages)
I would also like to say that the examples are much richer than the documentation on these controls, therefore it is better to see the examples right away than read the documentation itself.
')
So, we installed MS Chart. Create a new WinForms project. Put on him control Chart. Set the Area Area3DStyle.Enabled3D property to true. We put 3 Series sets with Spline types (this is one of the types of graphs that allows you to put several graphs on one Area). In summary, we have some idea that we can fill out with information. Then you can adjust the appearance of the graphs, colors and much more, which I did.
Next we need to create 3 PerfomanceCounter objects from the System.Diagnostics namespace:
#region Counters

private PerformanceCounter pcCpu;
private PerformanceCounter pcRam;
private PerformanceCounter pcPage;

/// <summary>
///
/// </summary>
private void InitCounters()
{
pcCpu = new PerformanceCounter( "Processor" , "% Processor Time" , "_Total" , Environment.MachineName);
pcRam = new PerformanceCounter( "Memory" , "% Committed Bytes In Use" , String .Empty, Environment.MachineName);
pcPage = new PerformanceCounter( "Paging File" , "% Usage" , "_Total" , Environment.MachineName);
}

/// <summary>
/// - PerformanceCounters
/// </summary>
private void DisposeCounters()
{
try
{
if (pcCpu != null )
pcCpu.Dispose();
if (pcRam != null )
pcRam.Dispose();
if (pcPage != null )
pcPage.Dispose();
}
finally
{
PerformanceCounter.CloseSharedResources();
}
}

#endregion

* This source code was highlighted with Source Code Highlighter .#region Thread Sample
private Thread addDataRunner;
public delegate void AddDataDelegate();
public AddDataDelegate addDataDel;
/// <summary>
/// ,
/// </summary>
/// <param name="e"></param>
protected override void OnLoad( EventArgs e)
{
base .OnLoad(e);
Application.DoEvents();
// create the Adding Data Thread but do not start until start button clicked
ThreadStart addDataThreadStart = new ThreadStart(AddDataThreadLoop);
addDataRunner = new Thread(addDataThreadStart);
// create a delegate for adding data
addDataDel += new AddDataDelegate(AddData);
// start worker threads.
if (addDataRunner.IsAlive == true )
{
addDataRunner.Resume();
}
else
{
addDataRunner.Start();
}
}
/// <summary>
/// 0.1
/// </summary>
private void AddDataThreadLoop()
{
while ( true )
{
if (!chartPerfomance.IsHandleCreated)
return ;
chartPerfomance.Invoke(addDataDel);
Thread.Sleep(100);
}
}
/// <summary>
///
/// </summary>
private void DisposeThread()
{
if ((addDataRunner.ThreadState & ThreadState.Suspended) == ThreadState.Suspended)
{
addDataRunner.Resume();
}
addDataRunner.Abort();
}
#endregion
* This source code was highlighted with Source Code Highlighter .#region Add Data
/// <summary>
///
/// </summary>
public void AddData()
{
DateTime timeStamp = DateTime .Now;
AddNewPoint(timeStamp, chartPerfomance.Series[0], pcCpu.NextValue());
AddNewPoint(timeStamp, chartPerfomance.Series[1], pcRam.NextValue());
AddNewPoint(timeStamp, chartPerfomance.Series[2], pcPage.NextValue());
}
/// <summary>
/// (timeStamp, nexVal) ptSeries
/// </summary>
/// <param name="timeStamp"></param>
/// <param name="ptSeries"></param>
/// <param name="nexVal"></param>
public void AddNewPoint( DateTime timeStamp, Series ptSeries, float nexVal )
{
ptSeries.Points.AddXY(timeStamp.ToOADate(), nexVal);
double removeBefore = timeStamp.AddSeconds( ( double )(9) * ( -1 )).ToOADate();
while ( ptSeries.Points[0].XValue < removeBefore )
{
ptSeries.Points.RemoveAt(0);
}
chartPerfomance.ChartAreas[0].AxisX.Minimum = ptSeries.Points[0].XValue;
chartPerfomance.ChartAreas[0].AxisX.Maximum = DateTime .FromOADate(ptSeries.Points[0].XValue).AddSeconds(10).ToOADate();
chartPerfomance.Invalidate();
}
#endregion
* This source code was highlighted with Source Code Highlighter .Now add the rotation logic:
#region Mouse Events

/// <summary>
///
/// </summary>
/// <param name="sender"></param>
/// <param name="e"></param>
private void chartPerfomance_MouseMove( object sender, MouseEventArgs e)
{
if (e.Button == MouseButtons.Left)
{
int x = savedRotation - (savedLocation.X - eX);
int y = savedInclination - (savedLocation.Y - eY);
chartPerfomance.ChartAreas[0].Area3DStyle.Rotation = Math .Max( Math .Min(x, 180), -180);
chartPerfomance.ChartAreas[0].Area3DStyle.Inclination = Math .Max( Math .Min(y, 90), -90);
}
}

/// <summary>
///
/// </summary>
/// <param name="sender"></param>
/// <param name="e"></param>
private void chartPerfomance_MouseDown( object sender, MouseEventArgs e)
{
if (e.Button == MouseButtons.Left)
{
Cursor = Cursors.NoMove2D;
savedLocation = e.Location;
savedRotation = chartPerfomance.ChartAreas[0].Area3DStyle.Rotation;
savedInclination = chartPerfomance.ChartAreas[0].Area3DStyle.Inclination;
}
}

/// <summary>
///
/// </summary>
/// <param name="sender"></param>
/// <param name="e"></param>
private void chartPerfomance_MouseUp( object sender, MouseEventArgs e)
{
if (e.Button == MouseButtons.Left)
{
Cursor = Cursors.Default;
}
}

private Point savedLocation;
private int savedRotation;
private int savedInclination;

#endregion

* This source code was highlighted with Source Code Highlighter .All three methods need to be attached to the Chart object on the MouseMove, MouseDown and MouseUp events, respectively.
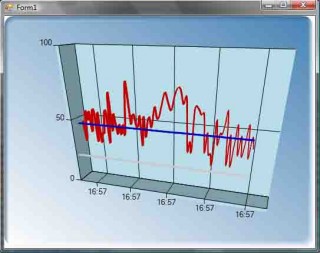
As a result, we should have the following result:
Here is a simple example of working with MS Chart. I want to say that this is quite a powerful library that provides the ability to present data in the form of graphs. And of the free analogues, probably the best. True, I know only one free analogue - ZedGraph , and before the advent of MS Chart I used it only. Not to say that MS Chart brought more functionality, but it has the ability to place smart signatures (so that they do not climb on each other), methods for calculating financial formulas (medians and much more), displaying legends and many more.
At the end I want to give a few links where you can still get information about MS Chart:
Download an example ...
Source: https://habr.com/ru/post/56688/
All Articles