Rules for tabular data. Rudiments of Numeracy by ASC Ehrenberg
In 1977, ASC Ehrenberg wrote and read a good and useful table design article in front of the British Royal Statistical Society: Rudiments of Numeracy. He cited 6 simple rules on how to improve readability, ease of analyzing tabular data and the attractiveness of the table as a whole.
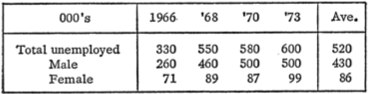
1. Round to two significant digits . It is not necessary to provide data in tables with great accuracy. For problems of comparison and analysis, it is completely enough for a person (and it will be easier) to see only two semantic digits in each number.
Not this way
')

And so

The rest of my resume here
http://nordisk.pp.ru/design/41/
or under the cut
2. Make a column or row with averages . This gives additional tools for analyzing the data itself (it helps to look for patterns or distributions. It even tells you how to do it. We take a look at the average value and then run through the data).
3. Build numbers intended for comparison in a column . Since the eye is much easier to run through the column than the term for comparing data. Moreover, this happens because the first digits in the number are usually compared, and the rest are skipped. This is another vote for rounding off to two effective numbers.
That is, if the data are compared, then in a bad table for this you need to change the rows and columns in places. Like this:

4. Build data in columns according to their size . For a person, it’s natural to expect a higher value at the top of the column. Of course, this rule should be applied if a different order was not originally conceived and it can in no way be changed.

5. Optimize data layout . The position of the data in the table should not force the eye trying to jump from one number to another.
This is terrible

6. Use graphics wisely . Charts clearly show the qualitative characteristics of the data, for example, dependencies or distributions. But they poorly show quantitative characteristics. Sometimes the schedule is a sly-spreadsheet that is cleverly spread out because of the abundance of tags on them, simply because they cannot cope with the task differently.

(Here, by the way, the author simply has a bad form of graphics)
The article is fully available in JSTOR. There is access from various scientific institutions such as universities and libraries, or I can send it to you if you write and give in exchange a useful link.
http://www.jstor.org/pss/2344922
1. Round to two significant digits . It is not necessary to provide data in tables with great accuracy. For problems of comparison and analysis, it is completely enough for a person (and it will be easier) to see only two semantic digits in each number.
Not this way
')
And so
The rest of my resume here
http://nordisk.pp.ru/design/41/
or under the cut
2. Make a column or row with averages . This gives additional tools for analyzing the data itself (it helps to look for patterns or distributions. It even tells you how to do it. We take a look at the average value and then run through the data).
3. Build numbers intended for comparison in a column . Since the eye is much easier to run through the column than the term for comparing data. Moreover, this happens because the first digits in the number are usually compared, and the rest are skipped. This is another vote for rounding off to two effective numbers.
That is, if the data are compared, then in a bad table for this you need to change the rows and columns in places. Like this:
4. Build data in columns according to their size . For a person, it’s natural to expect a higher value at the top of the column. Of course, this rule should be applied if a different order was not originally conceived and it can in no way be changed.
5. Optimize data layout . The position of the data in the table should not force the eye trying to jump from one number to another.
This is terrible
6. Use graphics wisely . Charts clearly show the qualitative characteristics of the data, for example, dependencies or distributions. But they poorly show quantitative characteristics. Sometimes the schedule is a sly-spreadsheet that is cleverly spread out because of the abundance of tags on them, simply because they cannot cope with the task differently.
(Here, by the way, the author simply has a bad form of graphics)
The article is fully available in JSTOR. There is access from various scientific institutions such as universities and libraries, or I can send it to you if you write and give in exchange a useful link.
http://www.jstor.org/pss/2344922
Source: https://habr.com/ru/post/54032/
All Articles