Windows crash dump analysis
How often do you have to contemplate the Windows death screen (BSoD)? BSoD can occur in different cases: as already when working with the system, and in the process of loading the operating system. How to determine what caused the appearance of BSoD and fix this problem? Windows can save a memory dump when an error occurs so that the system administrator can analyze the dump data and find the cause of the BSoD.
There are two types of memory dumps - small (minidump) and full. Depending on the settings of the operating system, the system may save full or small dumps, or take no action when an error occurs.
The small dump is located along the path % systemroot% \ minidump and has a name like Minixxxxxx-xx.dmp
The full dump is located along the path % systemroot% and has a name like Memory.dmp
')
To analyze the contents of memory dumps, you should use a special utility - Microsoft Kernel Debugger.
You can get the program and components necessary for its work directly from the Microsoft website - Debugging Tools
When choosing a debugger, consider the version of the operating system on which you will have to analyze memory dumps. For a 32-bit OS, a 32-bit version of the debugger is required, and for a 64-bit OS, it is preferable to use a 64-bit version of the debugger.
In addition to the Debugging Tools for Windows package itself, you will also need a set of debugging symbols - Debugging Symbols. The set of debugging symbols is specific for each OS on which BSoD was fixed. Therefore, you will have to download the character set for each OS, to analyze which work you will have. For 32-bit Windows XP, the character set for Windows XP is 32-bit, for 64-bit OS, the character set for Windows XP is 64-bit. For other OS family of Windows character sets are chosen according to the same principle. You can download debugging symbols from here . It is recommended to install them at % systemroot% \ symbols
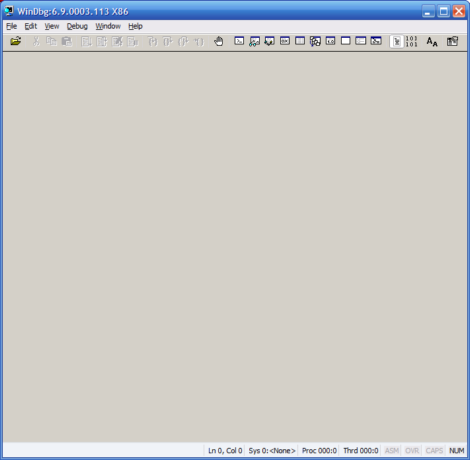
After installing the debugger and debugging symbols, we launch the debugger. The debugger window after launching looks like this.
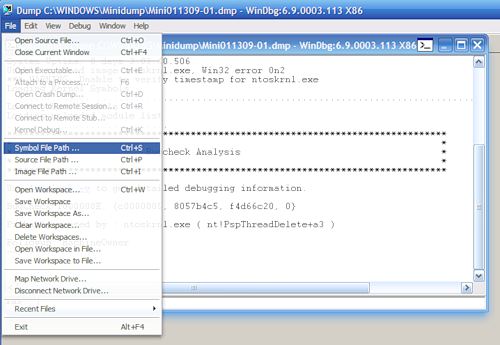
Before analyzing the contents of a memory dump, you will need to make a small debugger setup. Specifically, tell the program which way to look for debugging symbols. To do this, select File> Symbol File Path ... Click the Browse ... button and select the folder where we installed the debugging symbols for the memory dump in question.
You can request information about the required debugging symbols directly via the Internet, from the Microsoft public server. So you will have the newest version of the characters. You can do this as follows - in the File> Symbol File Path ... menu, type: SRV *% systemroot% \ symbols * http: //msdl.microsoft.com/download/symbols
After specifying the path to the debugging symbols, select File> Save workspace in the menu and confirm the action by pressing the OK button.
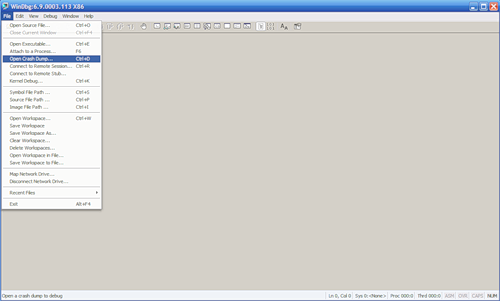
To start analyzing the memory dump, select the menu File> Open Crash Dump ... and select the required file for review.
The system will analyze the content, at the end of which will produce a result of the alleged cause of the error.
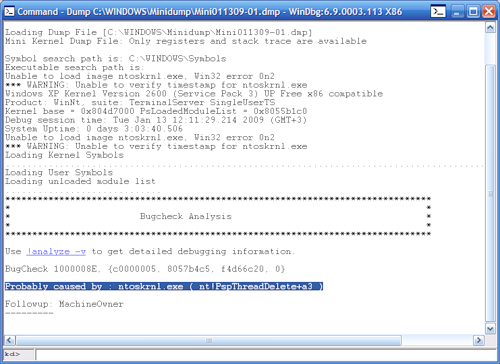
The! Analyze -v command, given to the debugger on the command line, will output more detailed information.
You can complete debugging by selecting the menu item Debug> Stop Debugging
Thus, using the Debugging Tools for Windows package, you can always get a fairly complete picture of the causes of system errors.
There are two types of memory dumps - small (minidump) and full. Depending on the settings of the operating system, the system may save full or small dumps, or take no action when an error occurs.
The small dump is located along the path % systemroot% \ minidump and has a name like Minixxxxxx-xx.dmp
The full dump is located along the path % systemroot% and has a name like Memory.dmp
')
To analyze the contents of memory dumps, you should use a special utility - Microsoft Kernel Debugger.
You can get the program and components necessary for its work directly from the Microsoft website - Debugging Tools
When choosing a debugger, consider the version of the operating system on which you will have to analyze memory dumps. For a 32-bit OS, a 32-bit version of the debugger is required, and for a 64-bit OS, it is preferable to use a 64-bit version of the debugger.
In addition to the Debugging Tools for Windows package itself, you will also need a set of debugging symbols - Debugging Symbols. The set of debugging symbols is specific for each OS on which BSoD was fixed. Therefore, you will have to download the character set for each OS, to analyze which work you will have. For 32-bit Windows XP, the character set for Windows XP is 32-bit, for 64-bit OS, the character set for Windows XP is 64-bit. For other OS family of Windows character sets are chosen according to the same principle. You can download debugging symbols from here . It is recommended to install them at % systemroot% \ symbols
After installing the debugger and debugging symbols, we launch the debugger. The debugger window after launching looks like this.
Before analyzing the contents of a memory dump, you will need to make a small debugger setup. Specifically, tell the program which way to look for debugging symbols. To do this, select File> Symbol File Path ... Click the Browse ... button and select the folder where we installed the debugging symbols for the memory dump in question.
You can request information about the required debugging symbols directly via the Internet, from the Microsoft public server. So you will have the newest version of the characters. You can do this as follows - in the File> Symbol File Path ... menu, type: SRV *% systemroot% \ symbols * http: //msdl.microsoft.com/download/symbols
After specifying the path to the debugging symbols, select File> Save workspace in the menu and confirm the action by pressing the OK button.
To start analyzing the memory dump, select the menu File> Open Crash Dump ... and select the required file for review.
The system will analyze the content, at the end of which will produce a result of the alleged cause of the error.
The! Analyze -v command, given to the debugger on the command line, will output more detailed information.
You can complete debugging by selecting the menu item Debug> Stop Debugging
Thus, using the Debugging Tools for Windows package, you can always get a fairly complete picture of the causes of system errors.
Source: https://habr.com/ru/post/52011/
All Articles